Combating America’s Other Infodemic
This projects won the First Place Prize at 2021 West Coast Regional Datathon sponsored by Citadel and CItadel Securities and Correlation One. The GitHub repository of this project can be found here. I am honored to have worked with three fantastic team members Ben, Jason and Peter.
The submitted version of the report can be downloaded here.
Summary: misconception, misinformation and COVID-19 pandemic control
Since the beginning of the pandemic, governments and technology companies around the world have prioritized combating false information about the COVID-19, along with public health measures, to ensure that people take adequate caustion and change their behavior to slow down the spread of the virus. In this project, we demontrated strong statistical relationships between people’s increased physical mobility and worse outcomes of COVID, as measured by infection, hospitalization and death at the state level. Moreover, we discovered that the incorrect information problem to COVID-19 containment turns our to be broader than misinformation from social or traditional media and extends to a lack of basic knowledge about the cause, spread and prevention of COVID-19 (misconception). Misconception is associated with higher non-essential mobility and worse disease outcomes.
Based on our models, we identified US states where, by geographic and demographic characters, where people are most vulnerable to the COVID-19 misconception or misinformation. We believe that the dissemination of correct information to people who are not necessarily exposed to much misinformation from the media, but nonetheless have more misconceptions about the basics of COVID-19.
Data source, preprocessing and EDA
We confine the time span of this study from March 2020 to January 2021.
Physical mobility
We use people’s physical movement at non-residential venues as a measurement of compliance to pandemic containment policies in the population. Google has made public datasets on movement of people available since February 15, 2020 to help combat COVID-19. As shown in the map below, states in Southern US, along with New York and small states in the northeast saw the most dramatic drop in non-residential mobility, By contrast, states in the northwest saw little change, or even increase in non-residential mobility.
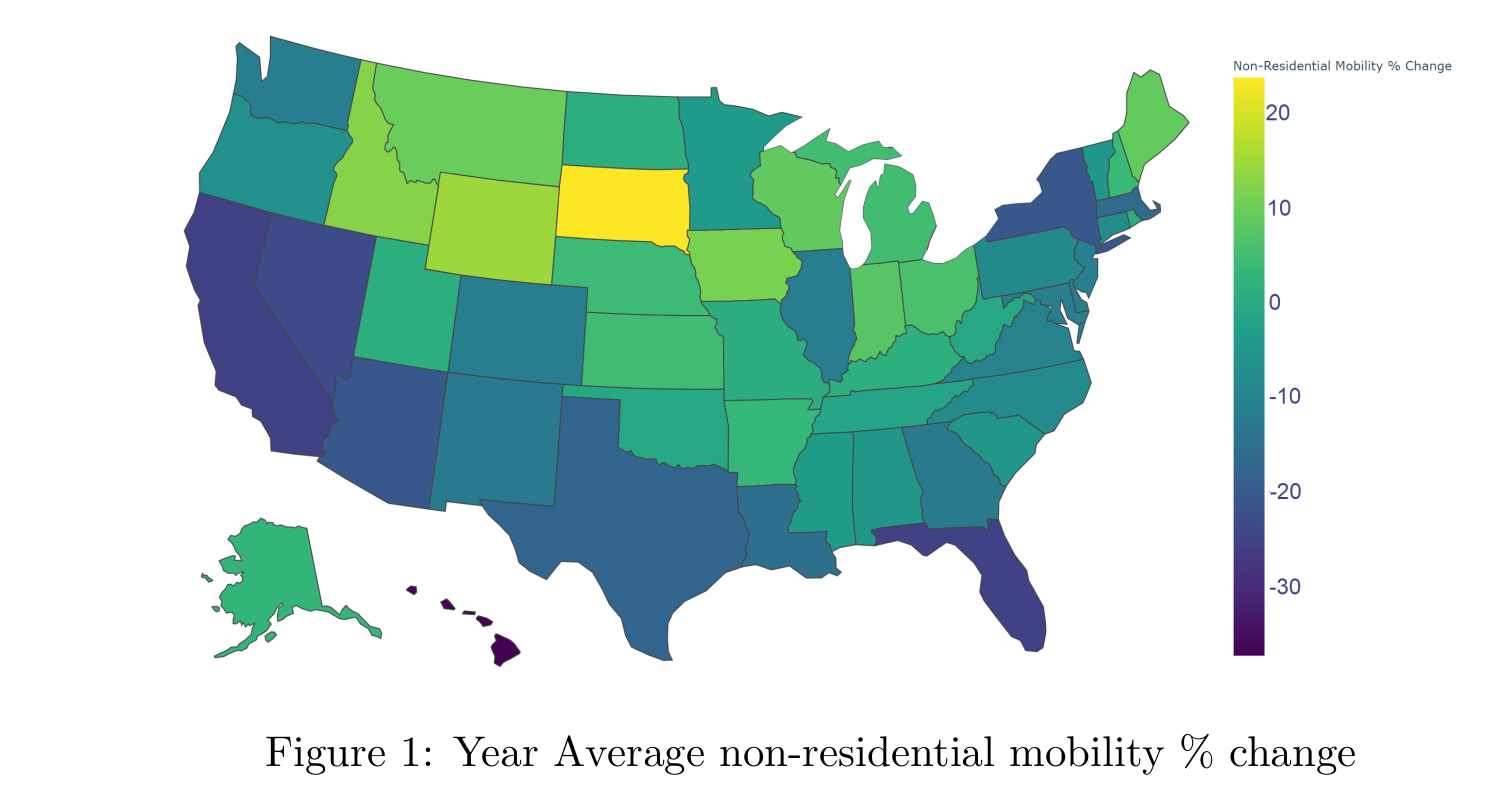
It turns out that in addition to differences in strictness of government policies and levels of compliance, Google Mobility data should also be used along with temperature and urbanization rate to get a more accurate picture. The baseline data was taken in January/February 2020, and residents of northern and colder states are naturally more stagnant during the winter months, and are thus more likely to be more mobile in the summer period. In addition, rural and urban residents also show different movement patterns. Therefore, as part of regression analyses, we have included a state’s average temperature and urbanization rate whenever the physical movement data is used.
Misconception and exposure to misinformation
Using survey data from CovidStates, we constructed indicators, we constructed the following two indicators:
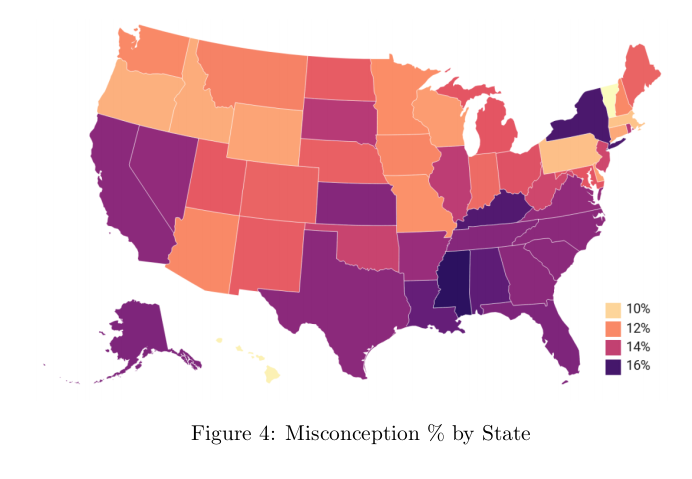
- Misconceptions about COVID-19. It is measured as the average proportion of false statements about the prevention and treatment of COVID-19 identified as correct by respondents. It appears that the southern states show much higher rates of misconceptions than the rest of the country.
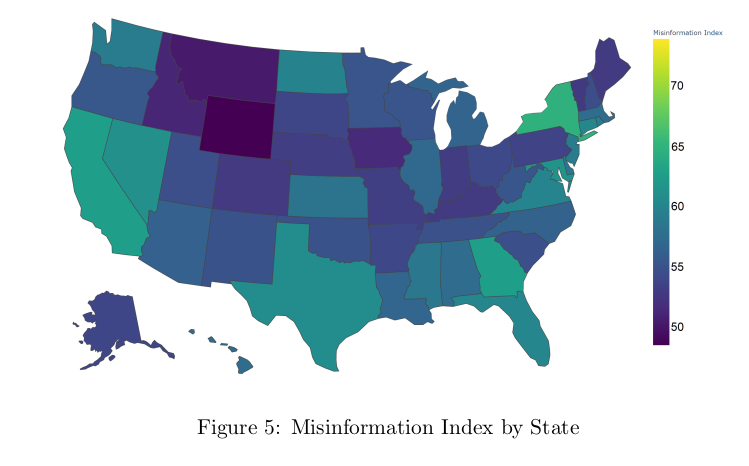
- Exposure to misinformation from social and traditional media. We took the average prevalence of false information by media source, weighted by the amount of usage of each media source for COVID-19 related information. Overall, we can see quite clearly that there are general trends between misinformation and misconceptions. Both southern states, and states with major metropolitan centers including California and New York, are more exposed to COVID-19 misinformation.
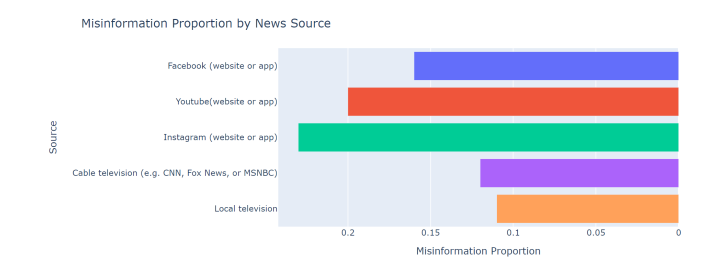
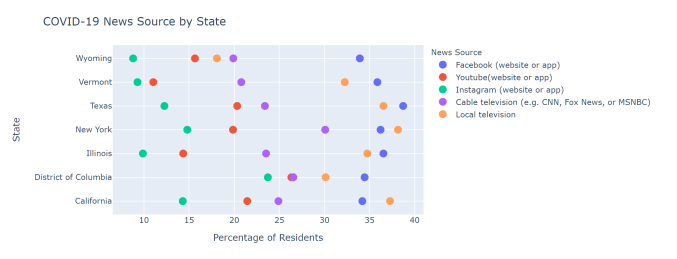
As shown in the bar-chart below, social media platforms, especially Instagram and YouTube, have higher high proportion of COVID-related information that is false. More urbanized areas such as Washington DC, California and New York have significantly higher proportion of residents who get information about COVID-19 from such sources, and are thus exposed to misinformation. By contrast, more rural states, like Wyoming and Vermont, are less exposed to Instagram and YouTube (levels of Facebook and traditional news usage are similar), and are thus less exposed to misinformation from the media.
COVID epidemiologies
The Covid Tracking Project, which has fortunately ended in March 2021, provides fantastic daily COVID pidemiological data at the U.S. state level. Key statistics that we used include:
-
New Deaths for each day
-
New Hospitalizations for each day
-
Current number of patients in ICU for each day
-
Current number of patients on ventilator
-
Test positivity rate for each day
Government pandemic control measures
we collected data about government restrictions to control the spread of COVID-19 at the state level, from the Covid-19 Policy Responses project run by Blavatnik School of Government, Oxford University. The dataset tracks closure of venues, cancellation of events, restrictions on gathering, stay-at-home orders, and restrictions on domestic and international movement.
Demographics
We compiled demographic data at the state level, covering characterstics including education, temperature, urbanization, age, race and economics, from a variety of sources. We want to find out what demographic features are associated to misconceptions about COVID-19 and exposure to COVID-19 misinformation.
Modelling
We are aware that there are many factors contributing to the COVID outcomes and simply linking the misinformation to the COVID through regression at high level may involve too much Omitted Variable Bias (OVB) and undermine causal relationship we want to investigate. Therefore, we would like to stay focused on proving one logical chain that we believe to be both important and interesting with statistical measures. In order to do so, we separated the whole process into steps: first we analyze COVID-Mobility relationship and then we investigate Mobility-Misinformation relationship. To be rigorous, we also investigated COVID-Misinformation relationship and included in the mobility-Misinformation section.
Impact of moblity on COVID spread
We applied panel regression to analyzing the relationship between mobility and the spread of COVID at the state level. To avoid the inverse causal relationship between mobility and COVID, we used 90 days leading techniques on dependent variables (COVID metrics). We are also aware of the multi-collinearity problem in our mobility features, and we therefore applied Principle Component Analysis (PCA) to summarize all the mobility features (capturing 87% vairance), and run the regression again, in addition to regressions on individual mobility features.
The models again shows statistical significance in the coefficient and proved the relationship between Mobility Index and the COVID statistics. More physical activities in non-essential lead to more infections of COVID-19.
Misconceptions, misinformation and disease outcomes
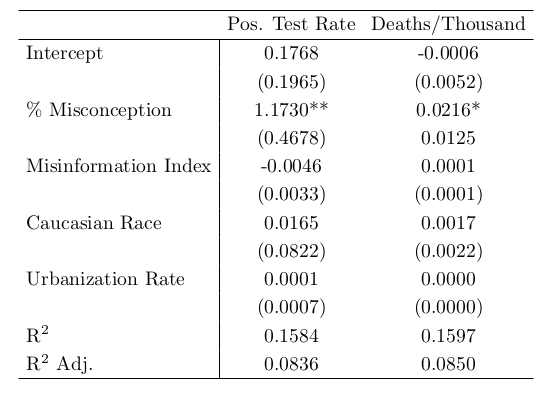
Due to a lack of panel data on misconceptions, misinformation and disease outcomes, We used cross-sectional regression to explore the relationship between misconceptions, misinformation and disease outcomes. As shown in the following table, the positive relationship between COVID-19 misconceptions and severity of disease outcomes hold. Also interesting is the fact that although misconceptions are related to worse disease outcomes, exposure to misinformation from media sources does not have a significant impact on disease outcomes.
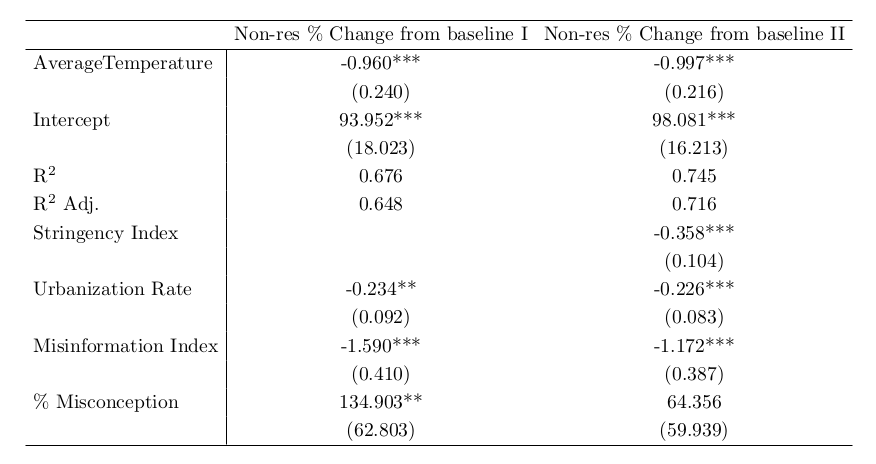
Through what mechanism does misconceptions and exposure to misinformation impact COVID-19 disease outcomes? We have found evidence to suggest that people who have more misconceptions about COVID-19 are less mindful about reducing physical movement. As shown in the following table, without controlling for level of strictness at each state, misconceptions are associated with more movement in non-residential areas. After controlling for strictness of government measures, the positive relationship between COVID-19 misconceptions and non-residential mobility remains, but the magnificence of impact decreases.
Also worth noting is the fact that higher exposure to media misinformation is shown to be associated with less mobility in non-residential areas. A possible explanation is that although certain media sources, especially social media platforms do contain large amount of misinformation, such information does not necessarily make people less likely to physically distance, or be careful in protecting themselves from COVID-19.
Identify vulnerable demographics
Misconceptions about COVID and exposure to misinformation
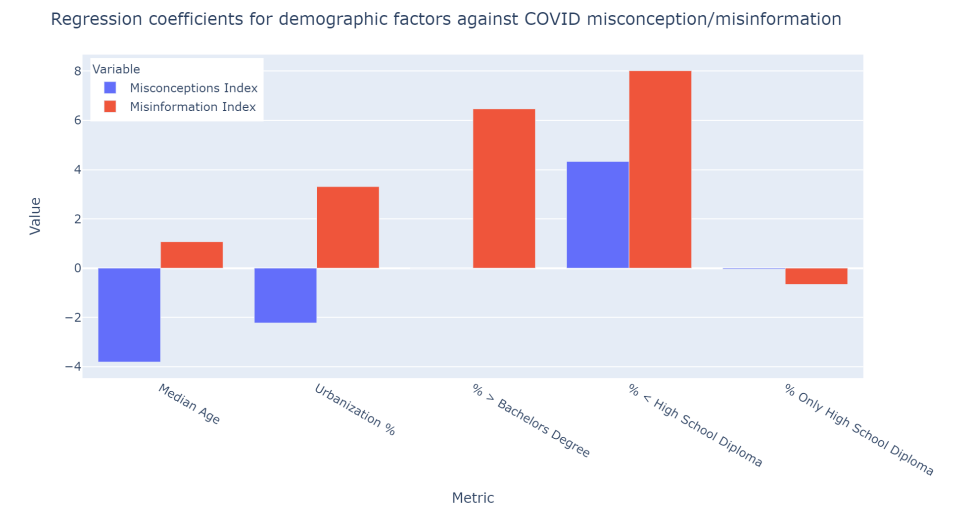
we found that both median age and urbanization percentage both showed statistically significant (below p=0.05) negative coefficients, while percentage of population with less than a high school diploma showed a statistically significant positive coefficient. This means that old, rural regions, with significant high school dropout rates are significantly more at risk for misconceptions than the rest of the country.
Conversely, for misinformation, we found a rather interesting different result. We found that percentage of population with less than a high school diploma, as well as percentage of population with greater than a bachelors degree, showed statistically significant positive coefficients, whereas those with only a high school diploma showed no strong directional coefficient. This means that misinformation is disproportionately affecting the lowest education levels, as well as the highest, but not those in the middle. We found this quite surprising.
Overall, this supports our original hypothesis that misinformation and misconceptions are two different issues plaguing the United States. The visualization below shows the change in coefficients from each regression, and the results of both of these models are provided in the appendix.
Mobility
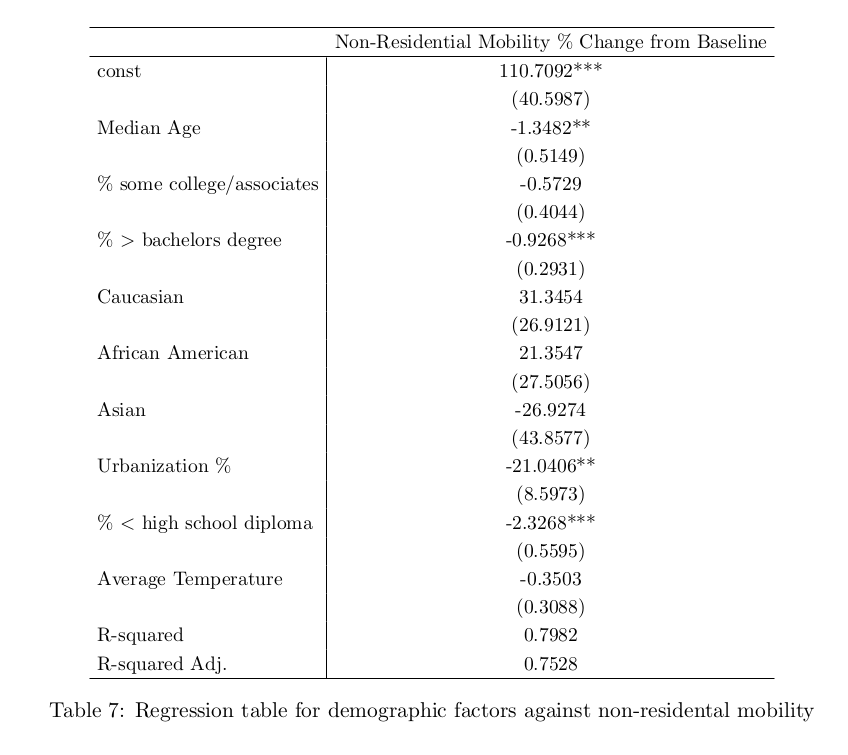
Similarly, here we are tring to potentially identify any links between demographic characterstics and extent of mobility drop during the pandemic. In this instance, we see that the most at risk group when it comes to mobility are those that are young, living in non-urban areas, with moderate education levels. Coefficients and p-values are included below:
Conclusions
This analysis highlights that between exposure to misinformation and possession of misconceptions about COVID-19, the latter is observably more strongly linked to potential lack of compliance to public health measures and therefore more severe pandemic effects. We have also identified demographics that are older, more rural, less educated (no high school diploma) and more economically disadvantaged are more likely to possess misconceptions about COVID-19, and in turn demonstrate more mobility in non-essential areas, less compliance to public health measures, and suffer more severe effects from the pandemic.
We suggest that federal and state governments and other agencies could effectively use their resources to craft more impactful measures and regulations, such as focusing on education for demographics vulnerable to misconception, while simultaneously combating digital misinformation in areas that sees more prevalence and spread. This targeted, two-pronged approach could address those most vulnerable to the pandemic, as well as prevent the formation of more misconception-vulnerable groups, ultimately alleviating the effects of not just COVID-19, but also future pandemics.

