Demographic Characters and Access to Public Transit in Greater Vancouver: Data Sources
A shorter high-level summary of the project can be found here. For an interactive web application with simulation results of priority neighborhoods, see here.
This is part 1 of a series of in-depth posts about this project including
For the Jupyter Notebook with full analysIs, please see here. The GitHub repo of this analysis is located here.
About the Project
Vancouver has one of the best public transit systems in North America. However, to what extent is access to public transit equitable among residents in the metropolitan area? From a plan and management perspective, what are the best locations to develop public transit infrastructure so that more people use public transit to commute? This project will explore accessibility to Vancouver’s public transit system across regions, and try to link it to people’s modes of commute.
This will be a series of blog posts and data visualizations. I will firstly explore the public transit data and present how public transit routes and stops are distributed geographically. I will then use the 2016 Census data to break the Greater Vancouver area into dissemination areas, and measure their access to public transit. I will then dig into 2016 Census data, especially records about people’s commute, and build machine learning models to identify areas where access to public transportation infrastructure restraints people’s transit use.
Data
There are two main data sources for this project. Detailed information on Vancouver’s mass transit system is obtained through Open Mobility Data in GTFS form. Canada’s 2016 Census data gives detailed information on the demographic characters of neighborhoods across the Greater Vancouver area.
GTFS Data
According to the official website of GTFS, it was originally known as Google Transit Feed Specification, a format of public transit data that is now used by urban transit agencies around the world. I will use GTFS data on Vancouver’s mass transit system as of June 6, 2020.
GTFS provides two types of public transit information, namely Static and Realtime. Static data. Generally speaking, provides information on how the transit system are planned to run. By contrast, realtime data gives information about how the transit system is actually running in real time. This project only uses the static part of GTFS data.
There are various tables in static data. I mainly use five of them: routes, shapes, stops, stop_times and trips.
- Routes
A route is a group of trips that are displayed to riders as a single service. There are 233 routes in Vancouver’s public transit system. Different modes of transportation are identified: among all routes, 3 are subways, one is rail, 228 are buses, and one is ferry.
- Trips
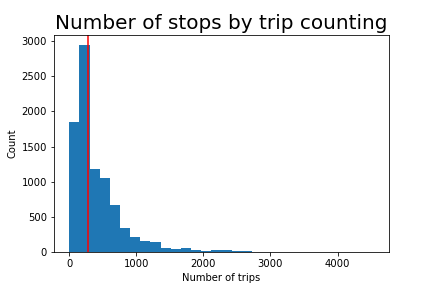
A trip is a sequence of two or more stops that occur during a specific time period, and one route usually has multiple trips. 122746 trips are identified in Vancouver: among them, route Expo Line has 4778 trips, which is the most among all routes, and route Dunbar/Downtown has 13 trips, which is the least among all routes.
As shown in the histogram below, each route has in average about 200 trips. Routes with more than 1,000 trips are rare.
- Shapes
A trip is geographically linked with a shape, which describes the path that a vehicle travels along a route alignment. According to GTFS, stops on a trip should “lie within a small distance of the shape for that trip.”
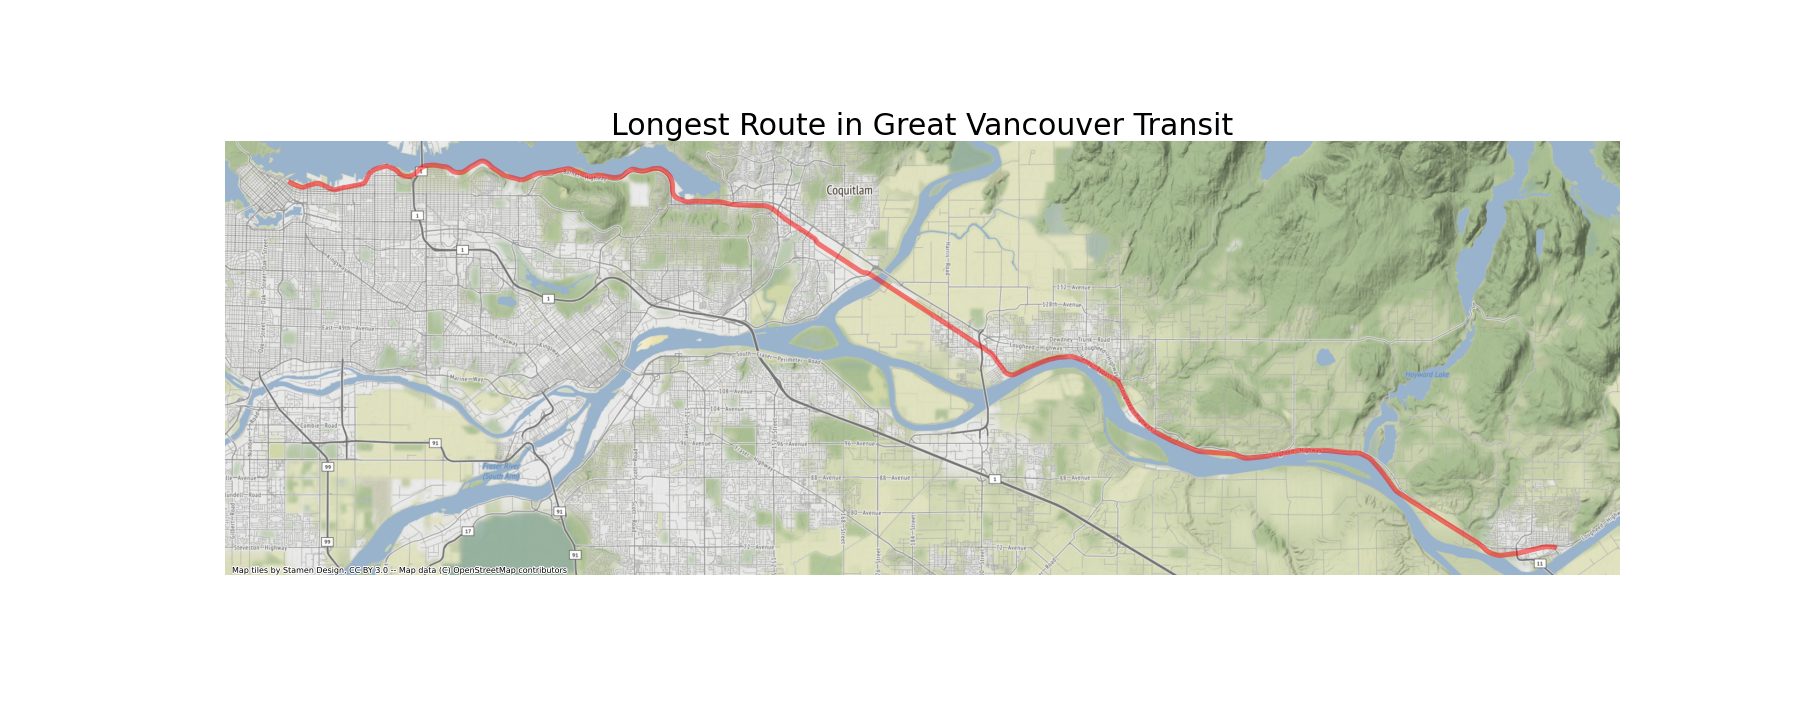
From the shape table, we can get more information about the length of each trip. For Vancouver, the median trip distance is 12.00 km. Route West Coast Express is 67.9 kms long, which is the longest route. This route stretches from downtown Vancouver to Mission, a town far up the Fraser River. Its map is presented below.
- Stops
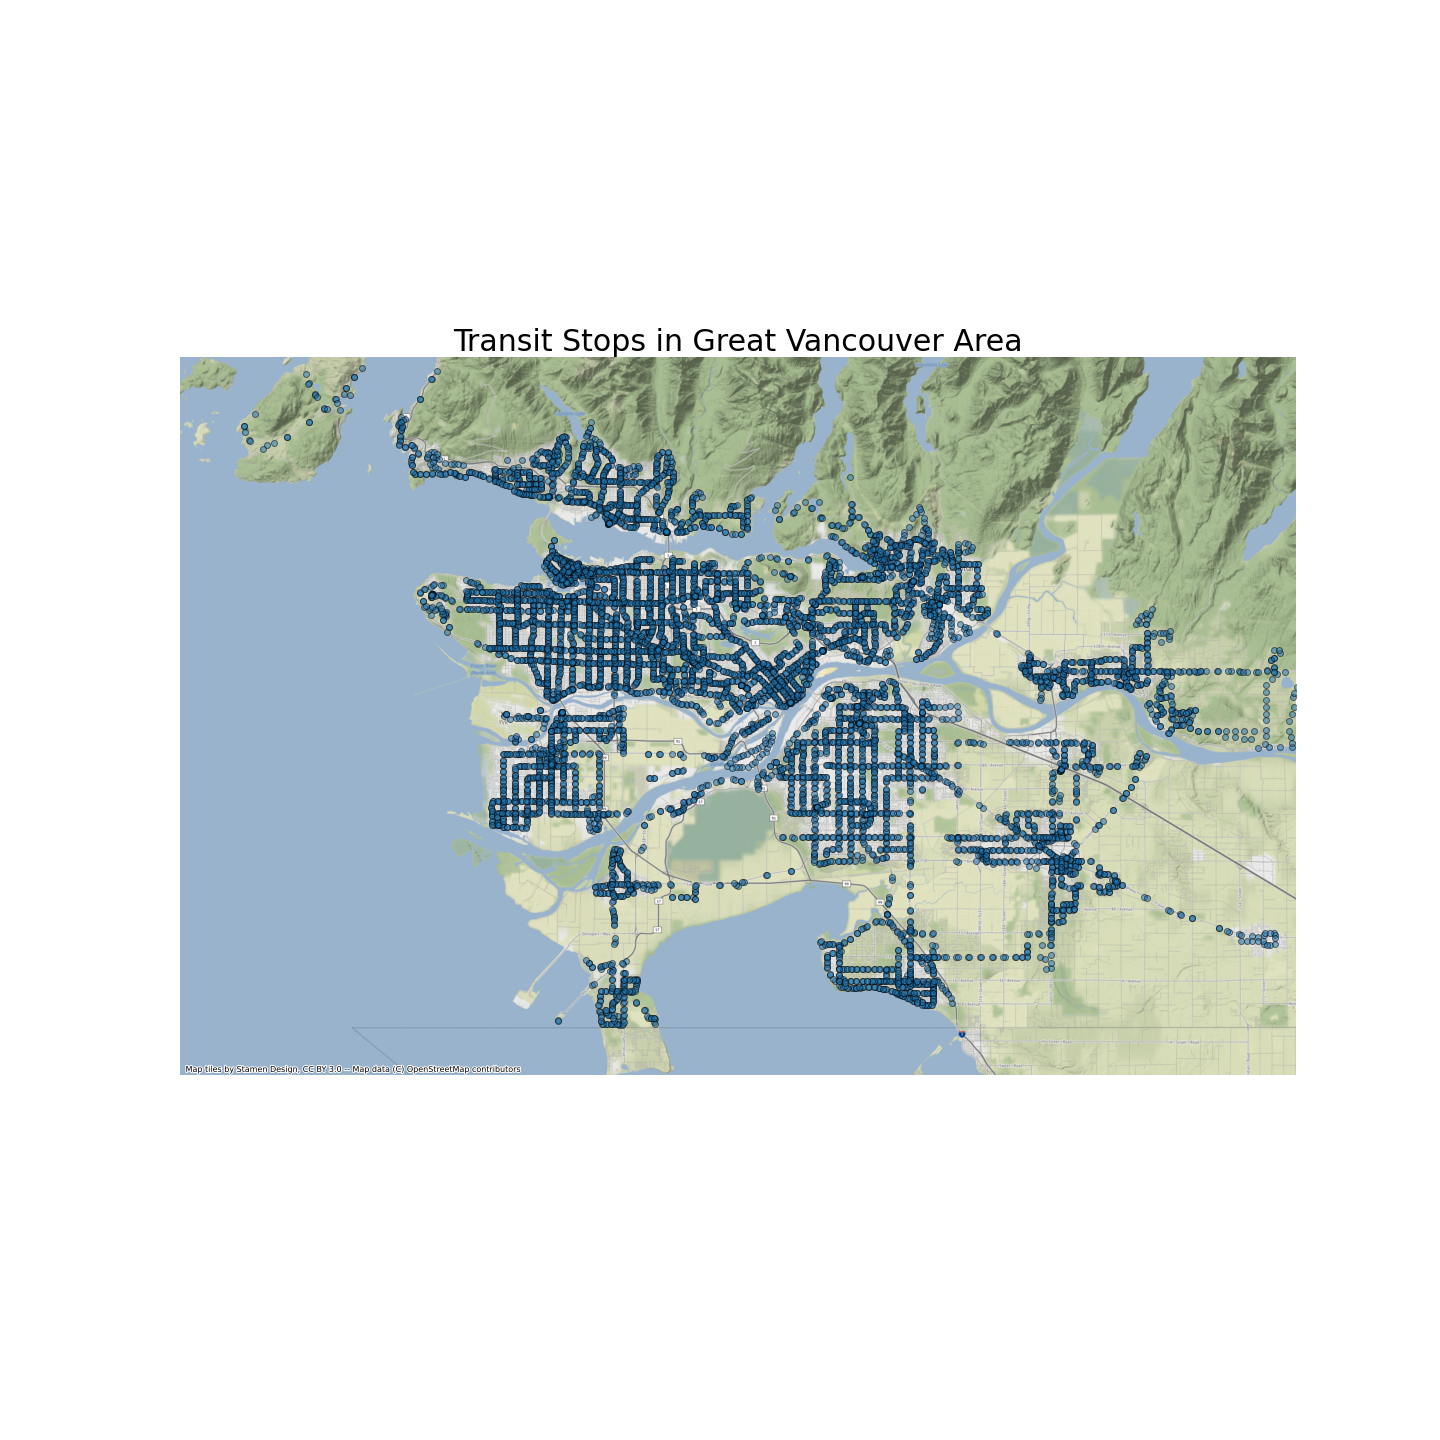
GTFS defines stops as places where vehicles pick up or drop off riders. Vancouver’s public transportation has 8919 stops identified.
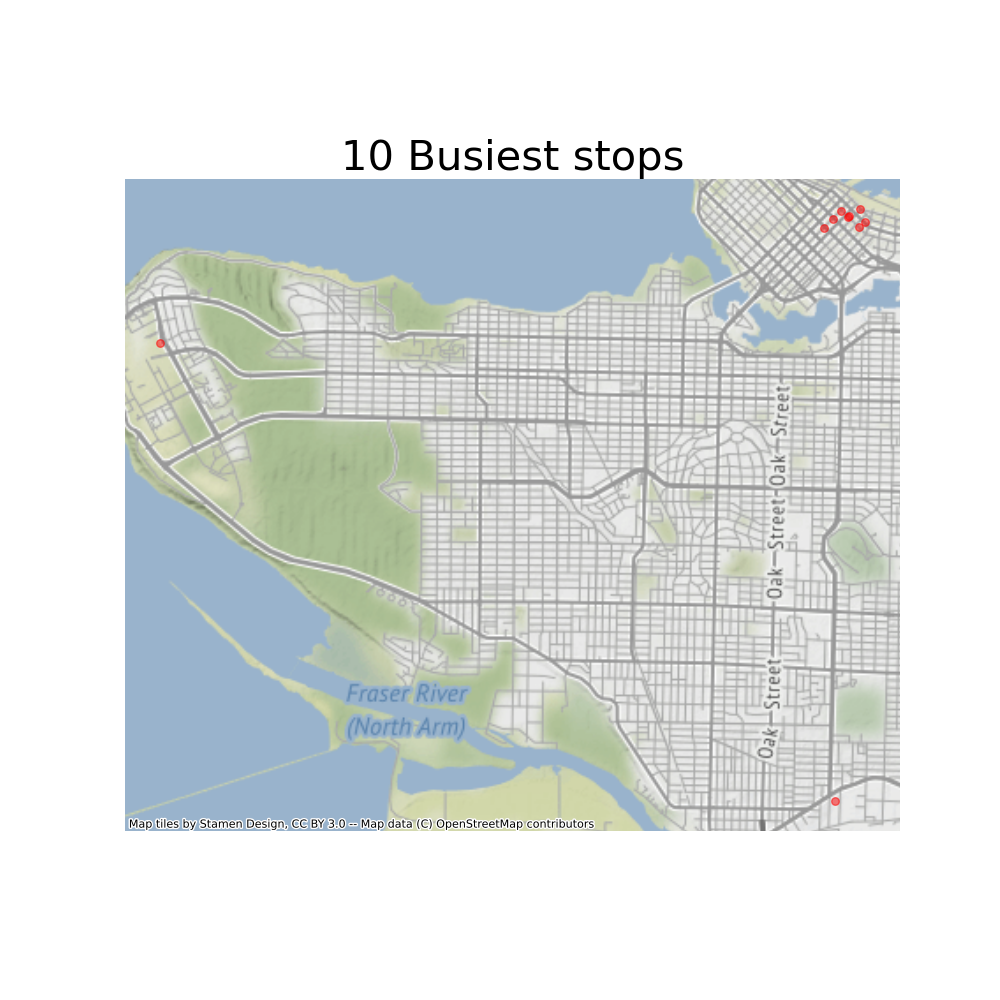
The following maps show all the stops, and the ten busiest among them. Most of the busiest stops are in the downtown area.
- Stop-times
The stop-times table gives detailed information about time when a vehicle arrives at and departs from stops for each trip. With this data, we can gain many important insights into the the operation of stops in the transit system.
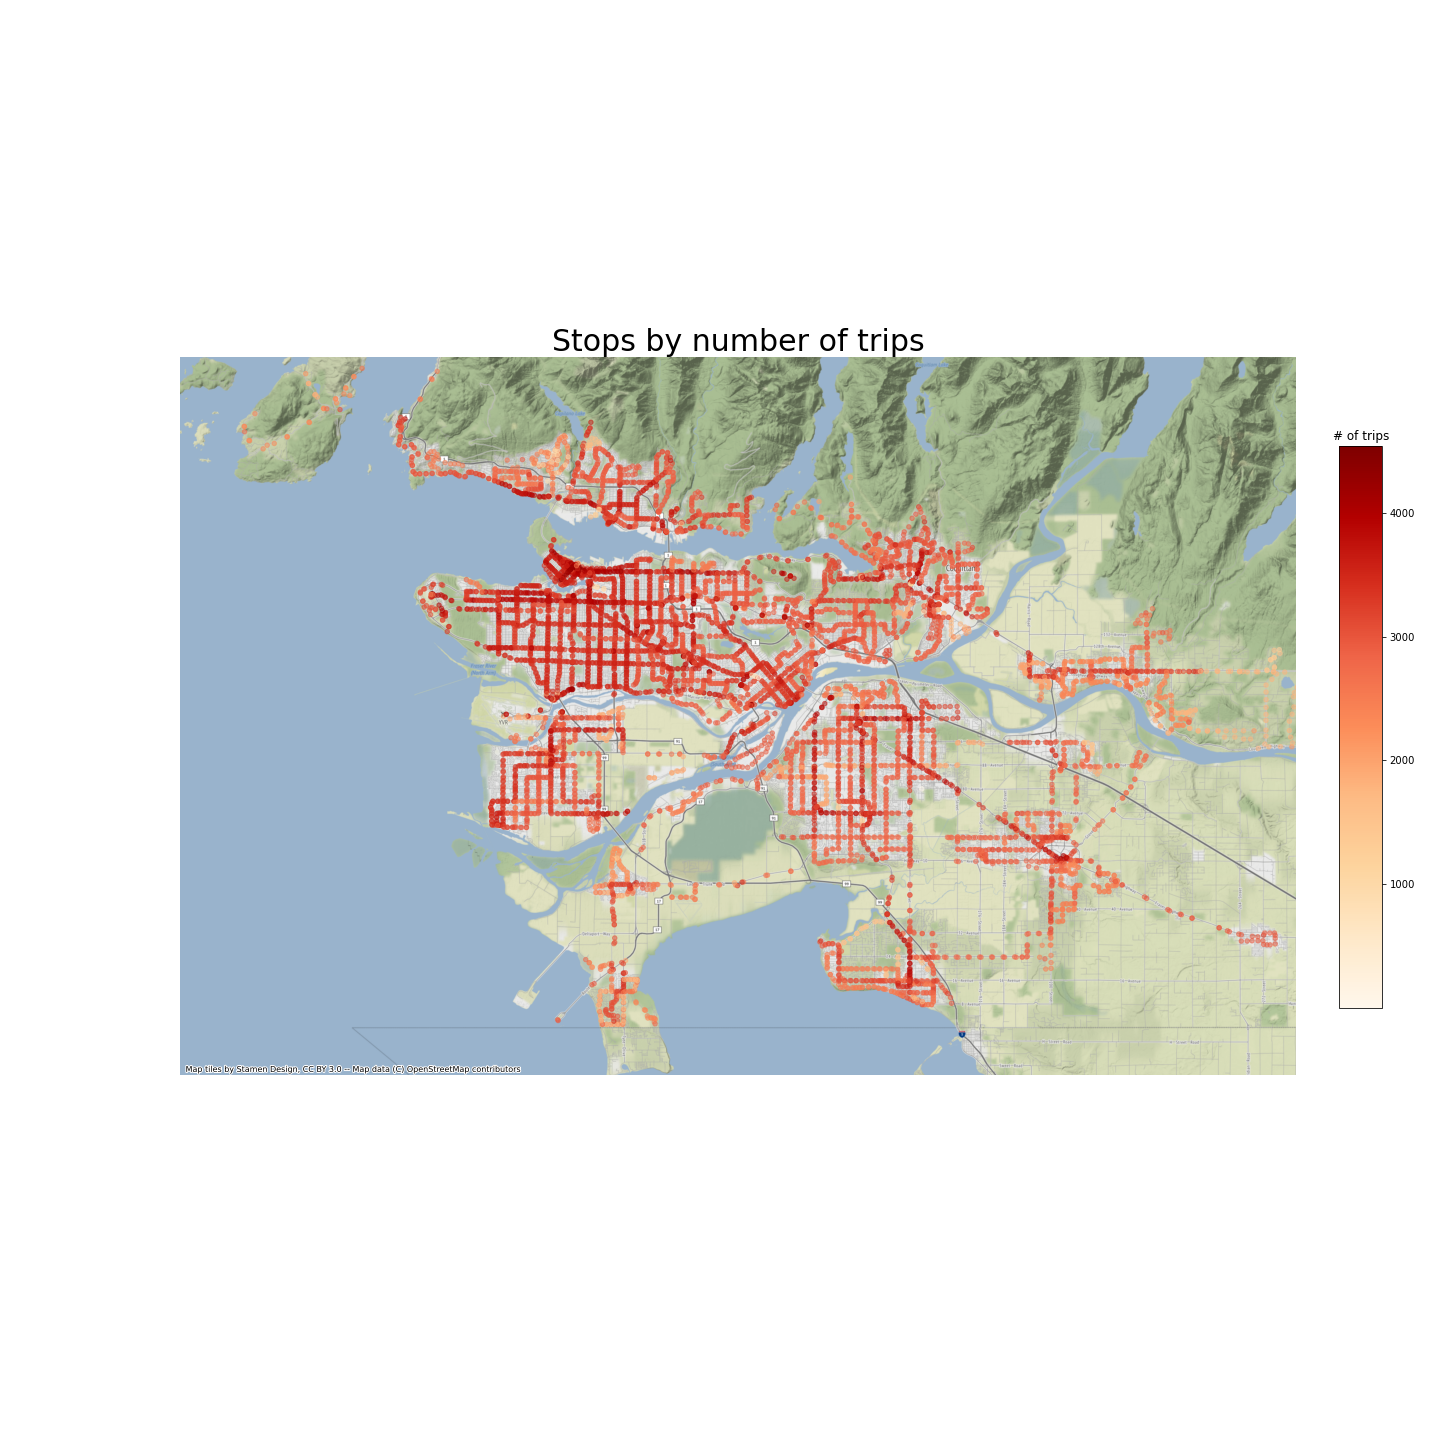
How busy are the public transit stops? The map below colors the stops by the number of trips they serve have per day. The busier stops are in the City of Vancouver, as well as along major roads.
2016 Census Data
The Canadian census conducted in 2016 provides important demographic and socio-economic information about neighborhoods in the Greater Vancouver Area. Greater Vancouver Area (GVA) is one of the 293 Census Divisions (CDs) in Canada, and we confine out analyses there.
The amount of data available from the census is enormous, and for this project, it is essential to understand how data is reported in a hierarchy of geographies. A useful graphical illustration can be found here. In short, this study utilizes data down to the Dissemination Area (DA) level, which, according to Statistics Canada:
is a small, relatively stable geographic unit composed of one or more adjacent dissemination blocks with an average population of 400 to 700 persons based on data from the previous Census of Population Program. It is the smallest standard geographic area for which all census data are disseminated.
Moreover, data at the DA level will also be aggregated to the Census Subdivision (CSD) and Census Consolidated Division (CCD) levels.
DAs in GVA
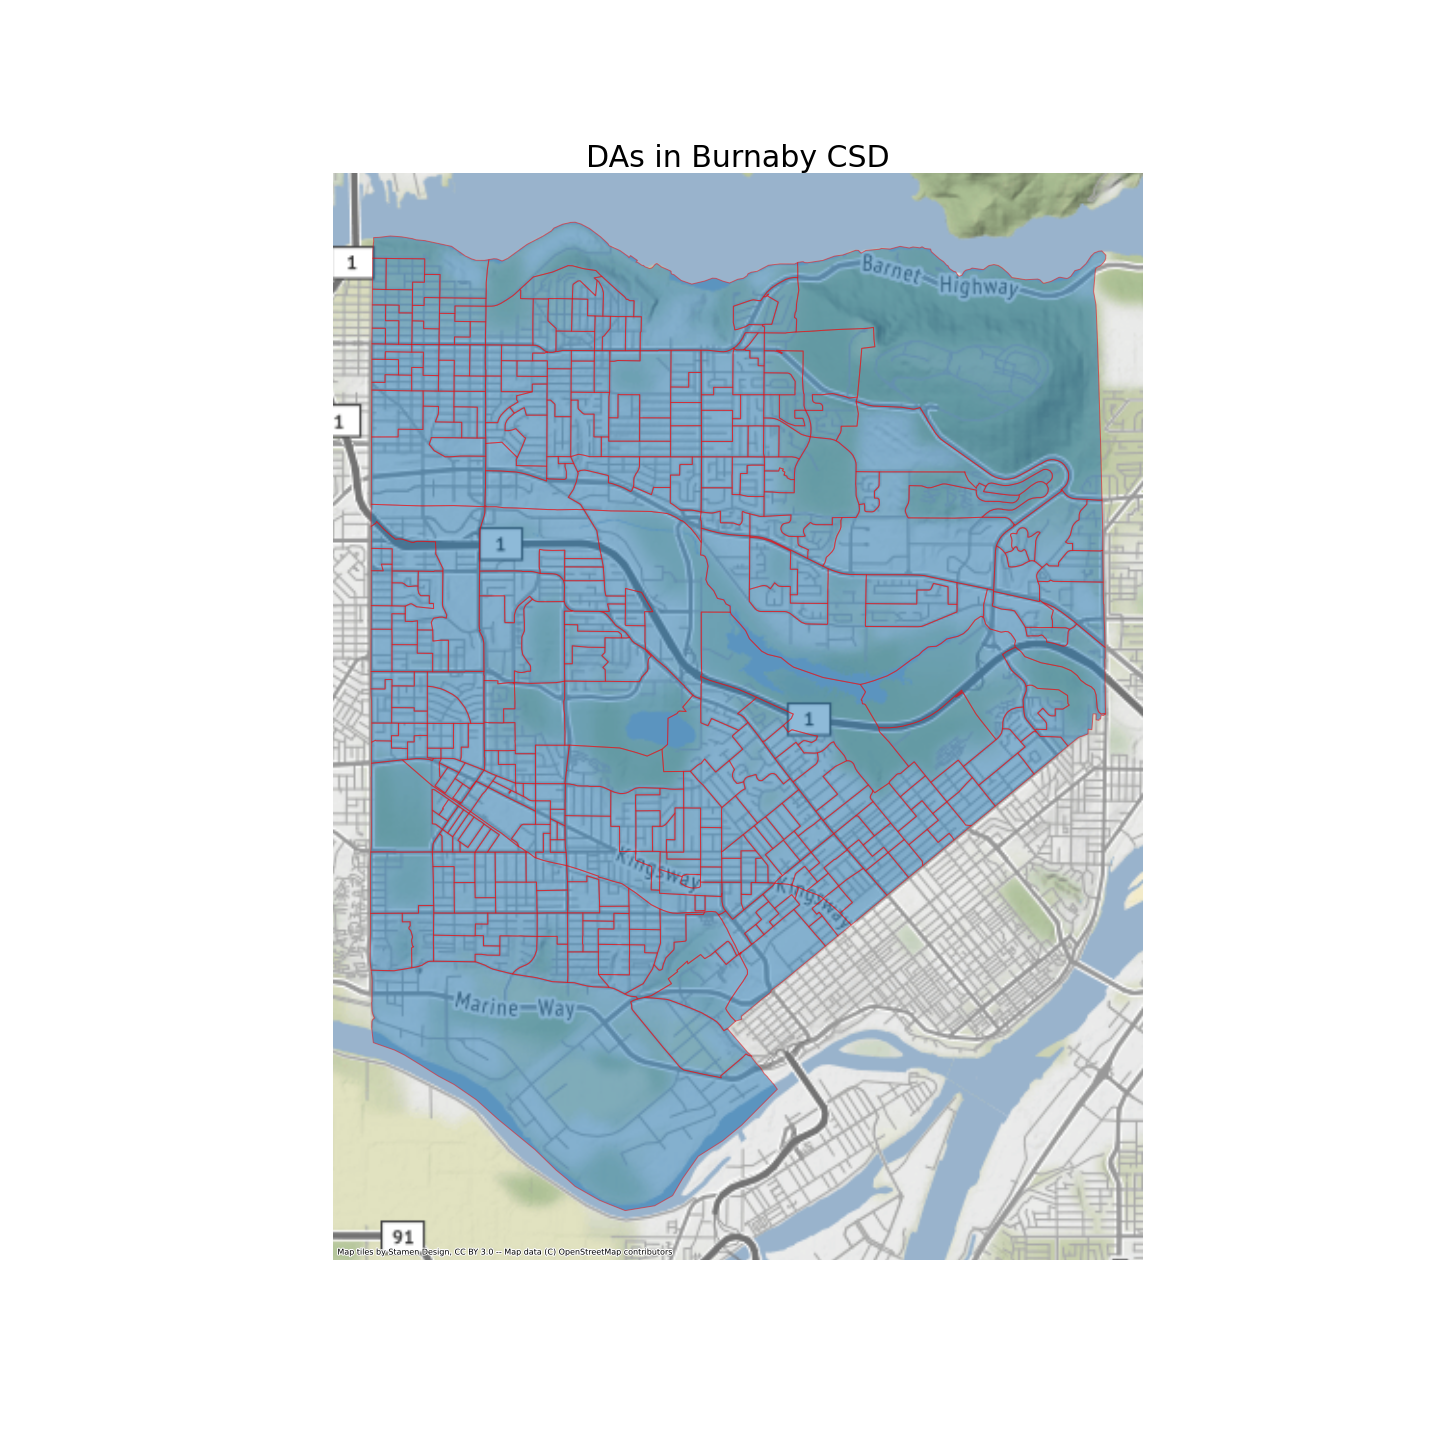
There are 3450 DAs in GVA. The following map shows the boundaries of about 322 DAs in Burnaby CSD.
The following table summarizes the basic demographic and geographical characters of DAs in GVA.
| 2016 Pop. | Total Private Dwellings | Pop. per km2 | Land Area (km2) | |
|---|---|---|---|---|
| mean | 714 | 297.9 | 6105.4 | 0.8 |
| std | 509.1 | 254.3 | 10170.7 | 14 |
| min | 0 | 0 | 0 | 0 |
| 25% | 477 | 176 | 2583.4 | 0.1 |
| 50% | 586 | 229 | 4091.7 | 0.1 |
| 75% | 766.5 | 328 | 6875.5 | 0.2 |
| max | 8778 | 5631 | 454783 | 796.1 |
- Population
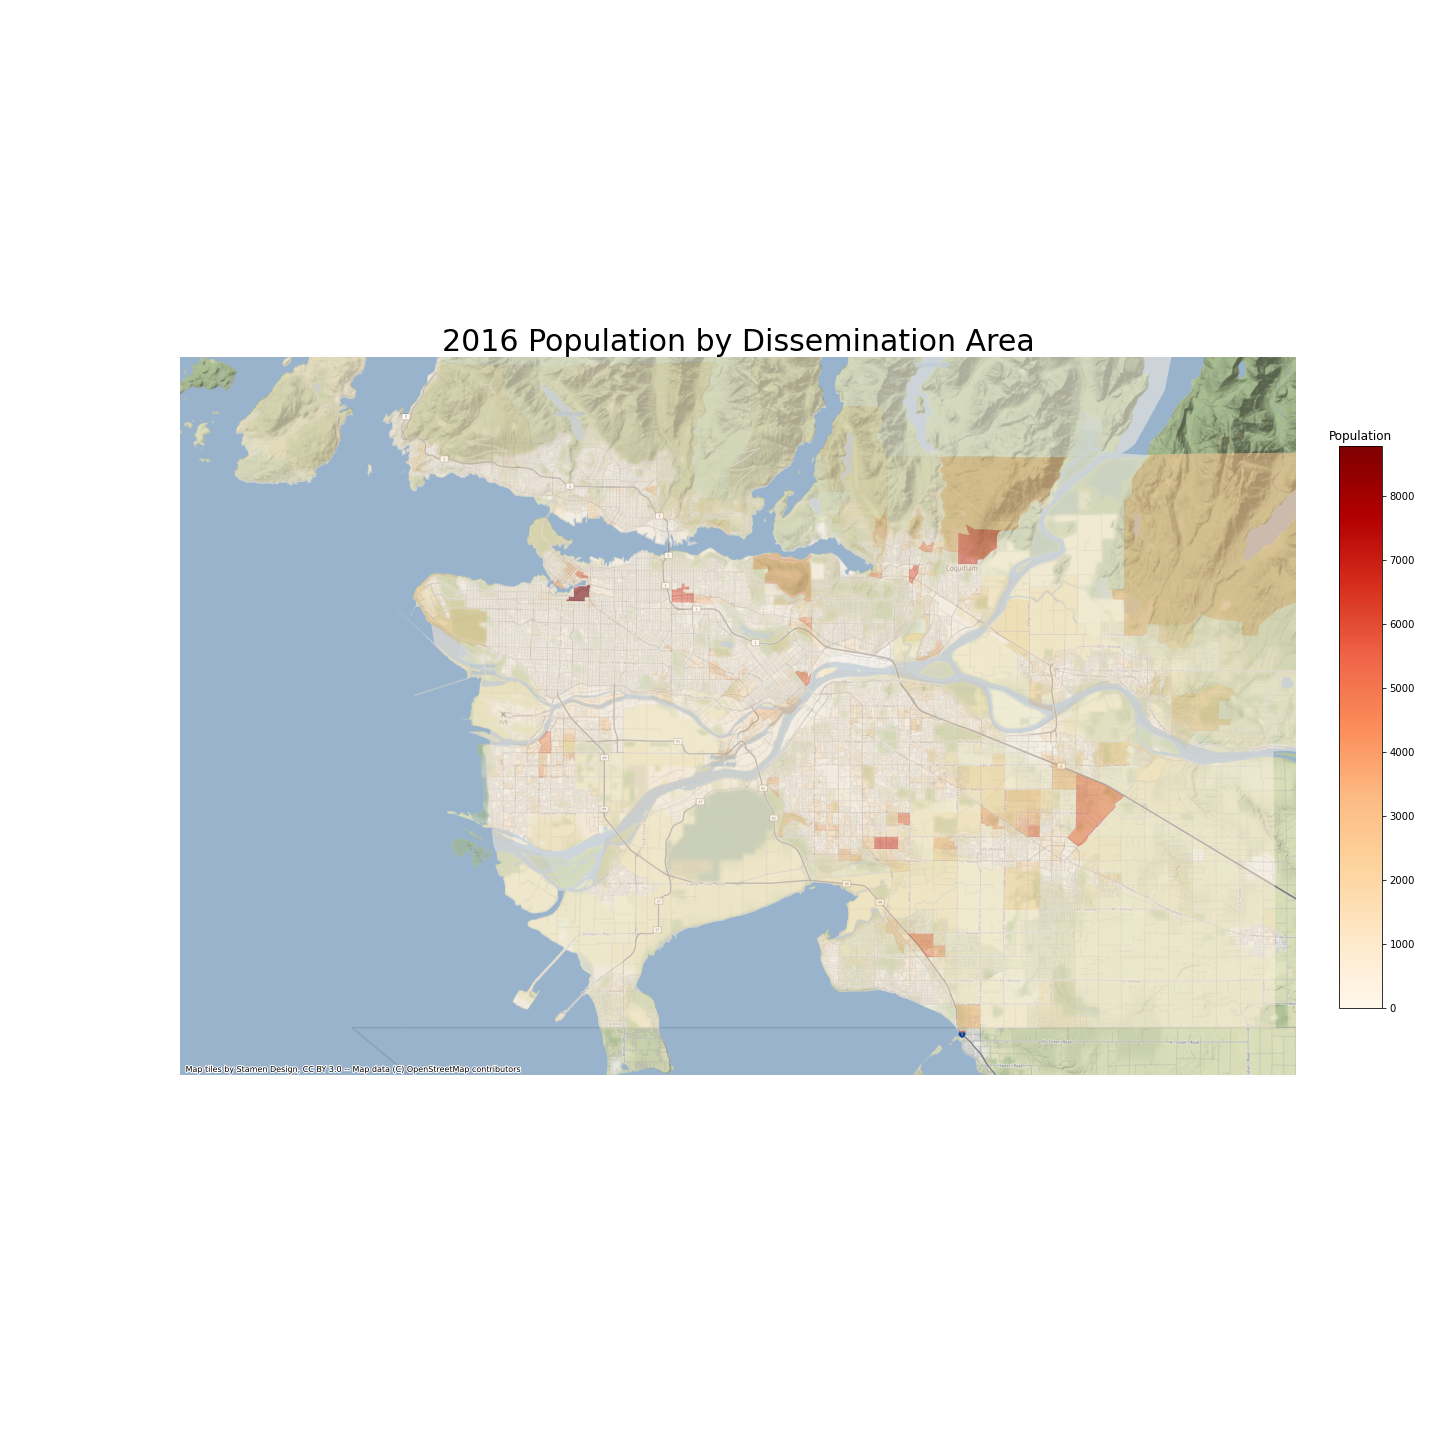
In average, each DA has 714 persons as of 2016 census. The following map shows the population counts across DAs. DAs with most population are not concentrated in the downtown area. Instead, they are scattered in Surrey and Coquitlam.
- Population density
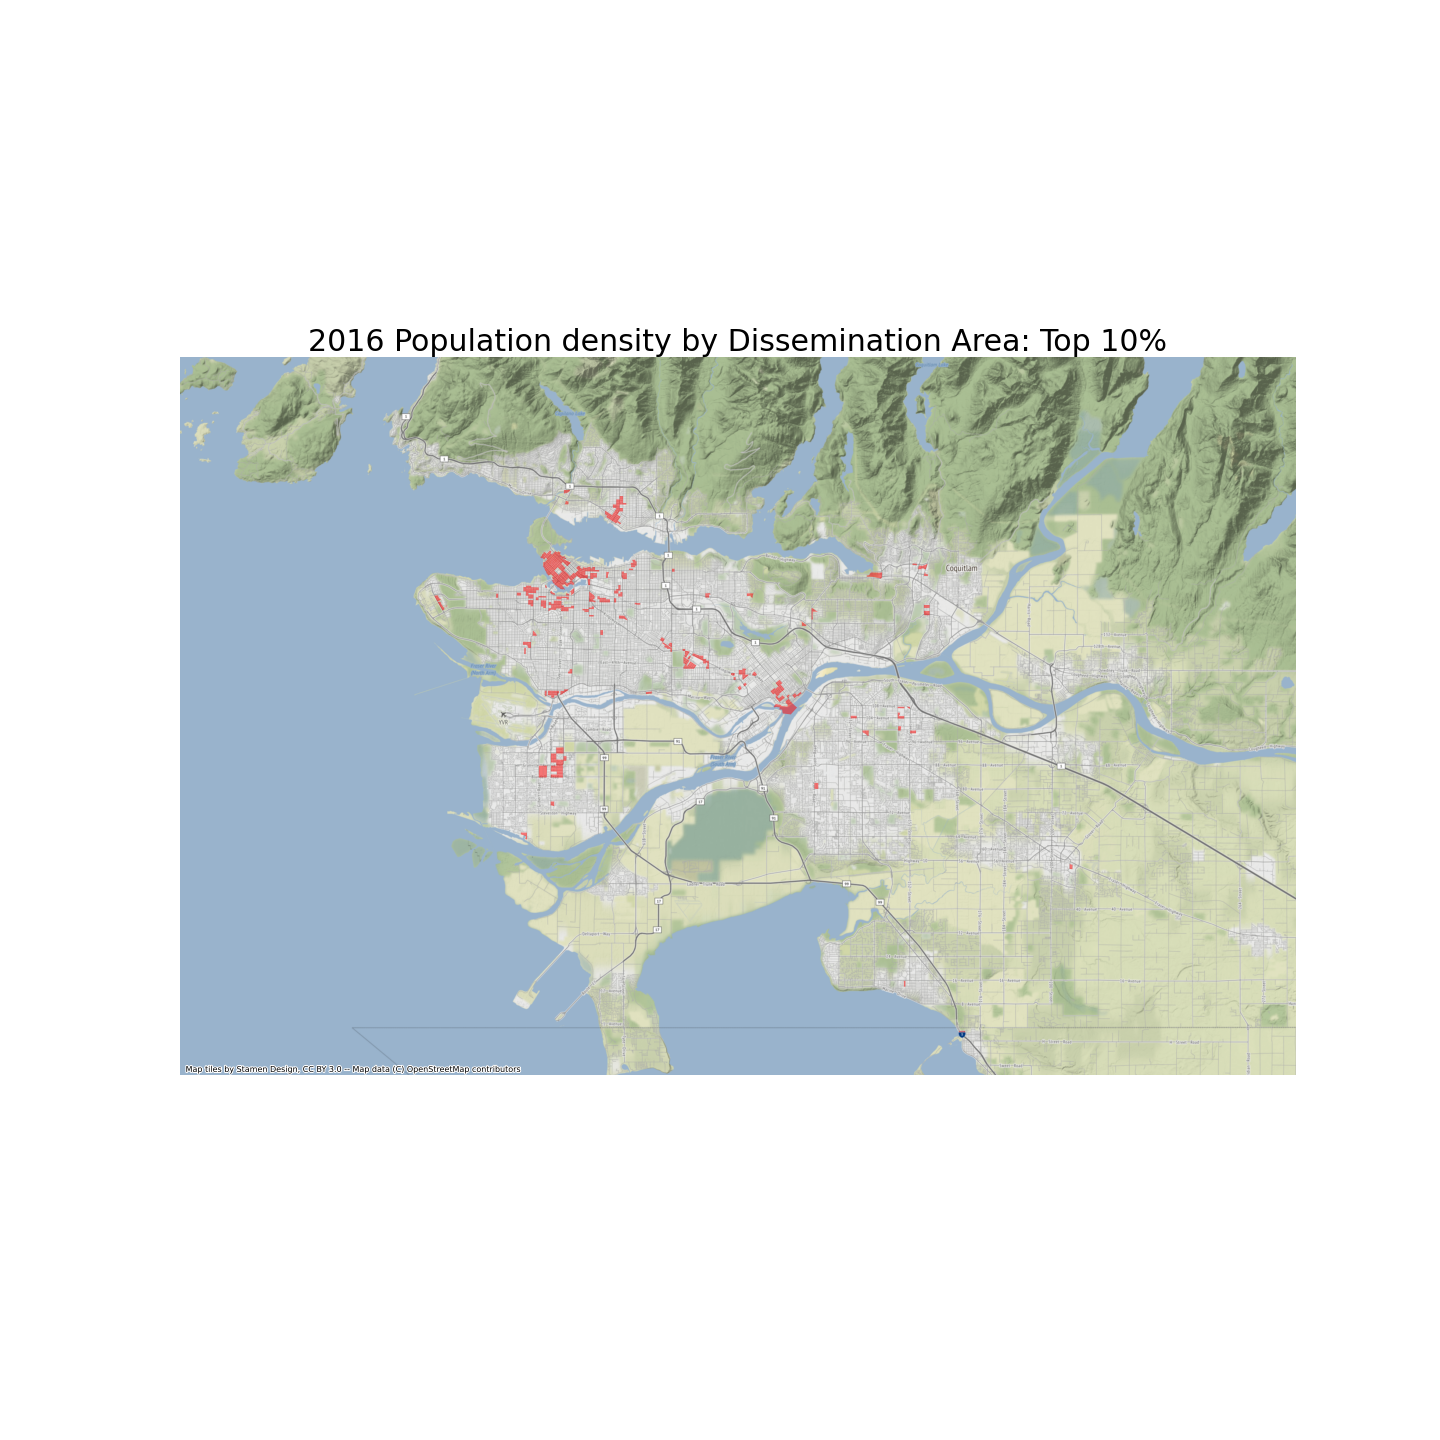
The following map shows the population density among DAs in GVA. The majority of DAs have relatively low population density, and dense DAs are mostly near the downtown area. The following map highlights the DAs with top 10% population density in GVA. Most such DAs are distributed in downtown, Kitsilano and Fairview areas.
Conclusion
From 2016 census and GTFS data, we can extract variables that interest us. As a policy question, the study intends to figure out as Vancouver’s public transit authority distributes additional transportation capacities, where and when it should prioritize to maximize the usage of public transit across the metropolitan area. We will discuss the key variables in the next post.
