Demographic Characters and Access to Public Transit in Greater Vancouver: Key Variables
A shorter high-level summary of the project can be found here. For an interactive web application with simulation results of priority neighborhoods, see here.
This is part 2 of a series of in-depth posts about this project including
- data sources
- key variables
- machine learning modeling, and
- model analyses and recommendations. For the Jupyter Notebook with full analysIs, please see here. The GitHub repo of this analysis is located here.
Access to public transit
GTFS is a great data source to gauge access to public transit from. This analysis defines access to public transit in the following two ways:
(1) Number of transit services available in the neighborhood area of a DA, divided by the total population of the DA.
(2) Number of transit stops in the the neighborhood area of a DA, divided by the total population of the DA.
The neighborhood area of a DA is defined as all points within the geographical boundary of the DA, along with a buffer zone that includes all points around the DA where the straight line distance between that point, and at least one point in the DA, is less than 500 meters.
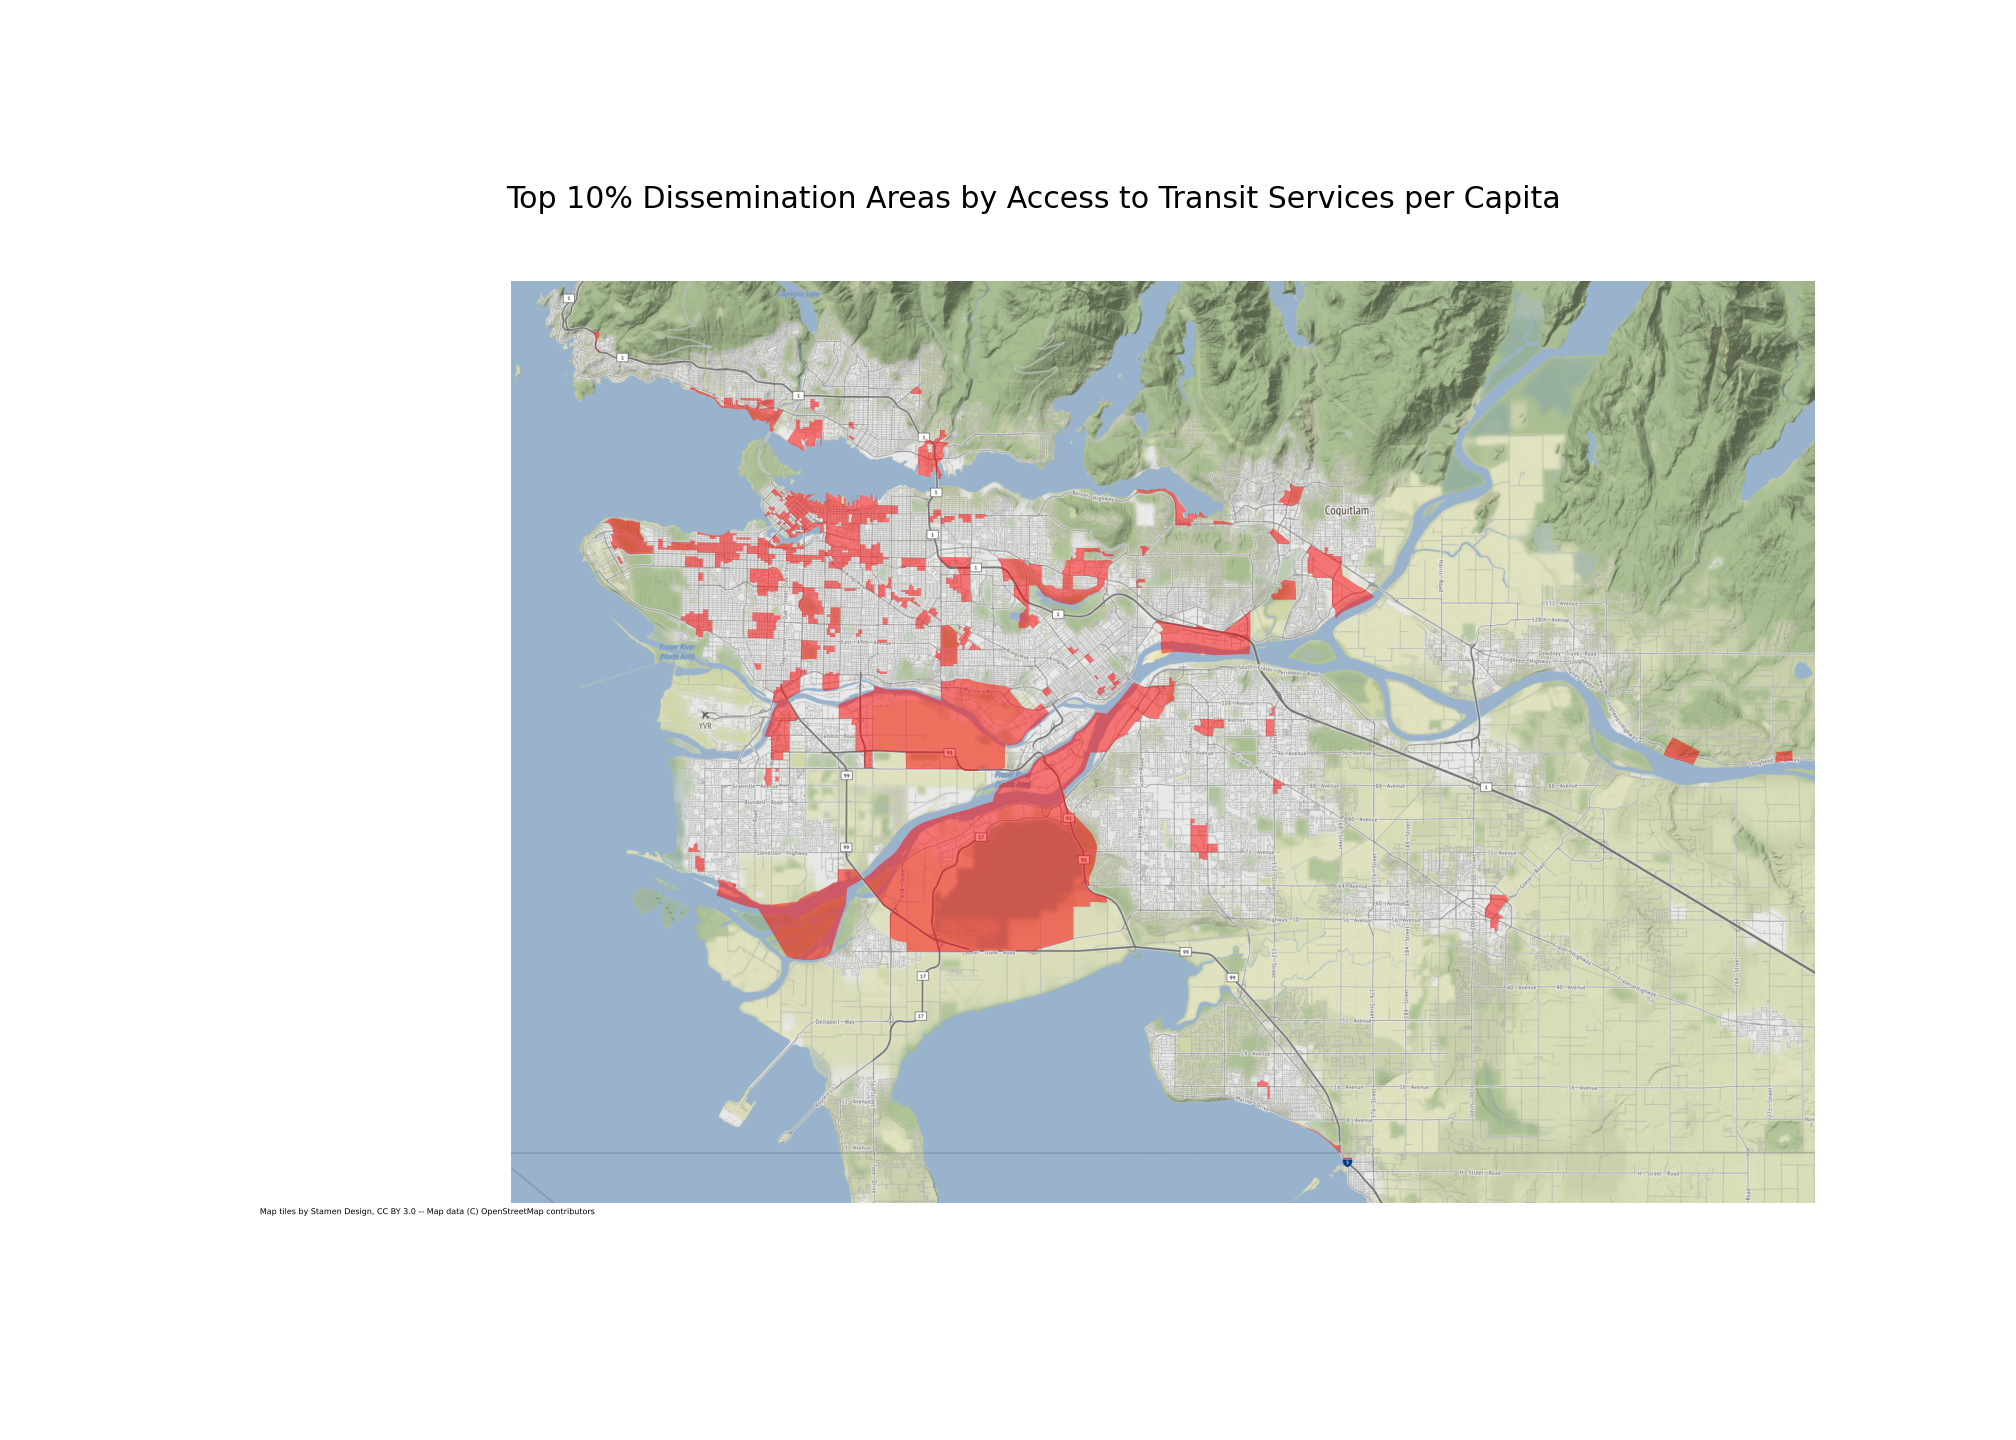
The following map shows the DAs with top 10% of transit service per capita. Such area are concentrated in the eastern part of the downtown core, and the areas to its immediate east. Kitsland also sees relatively high access to transit service.
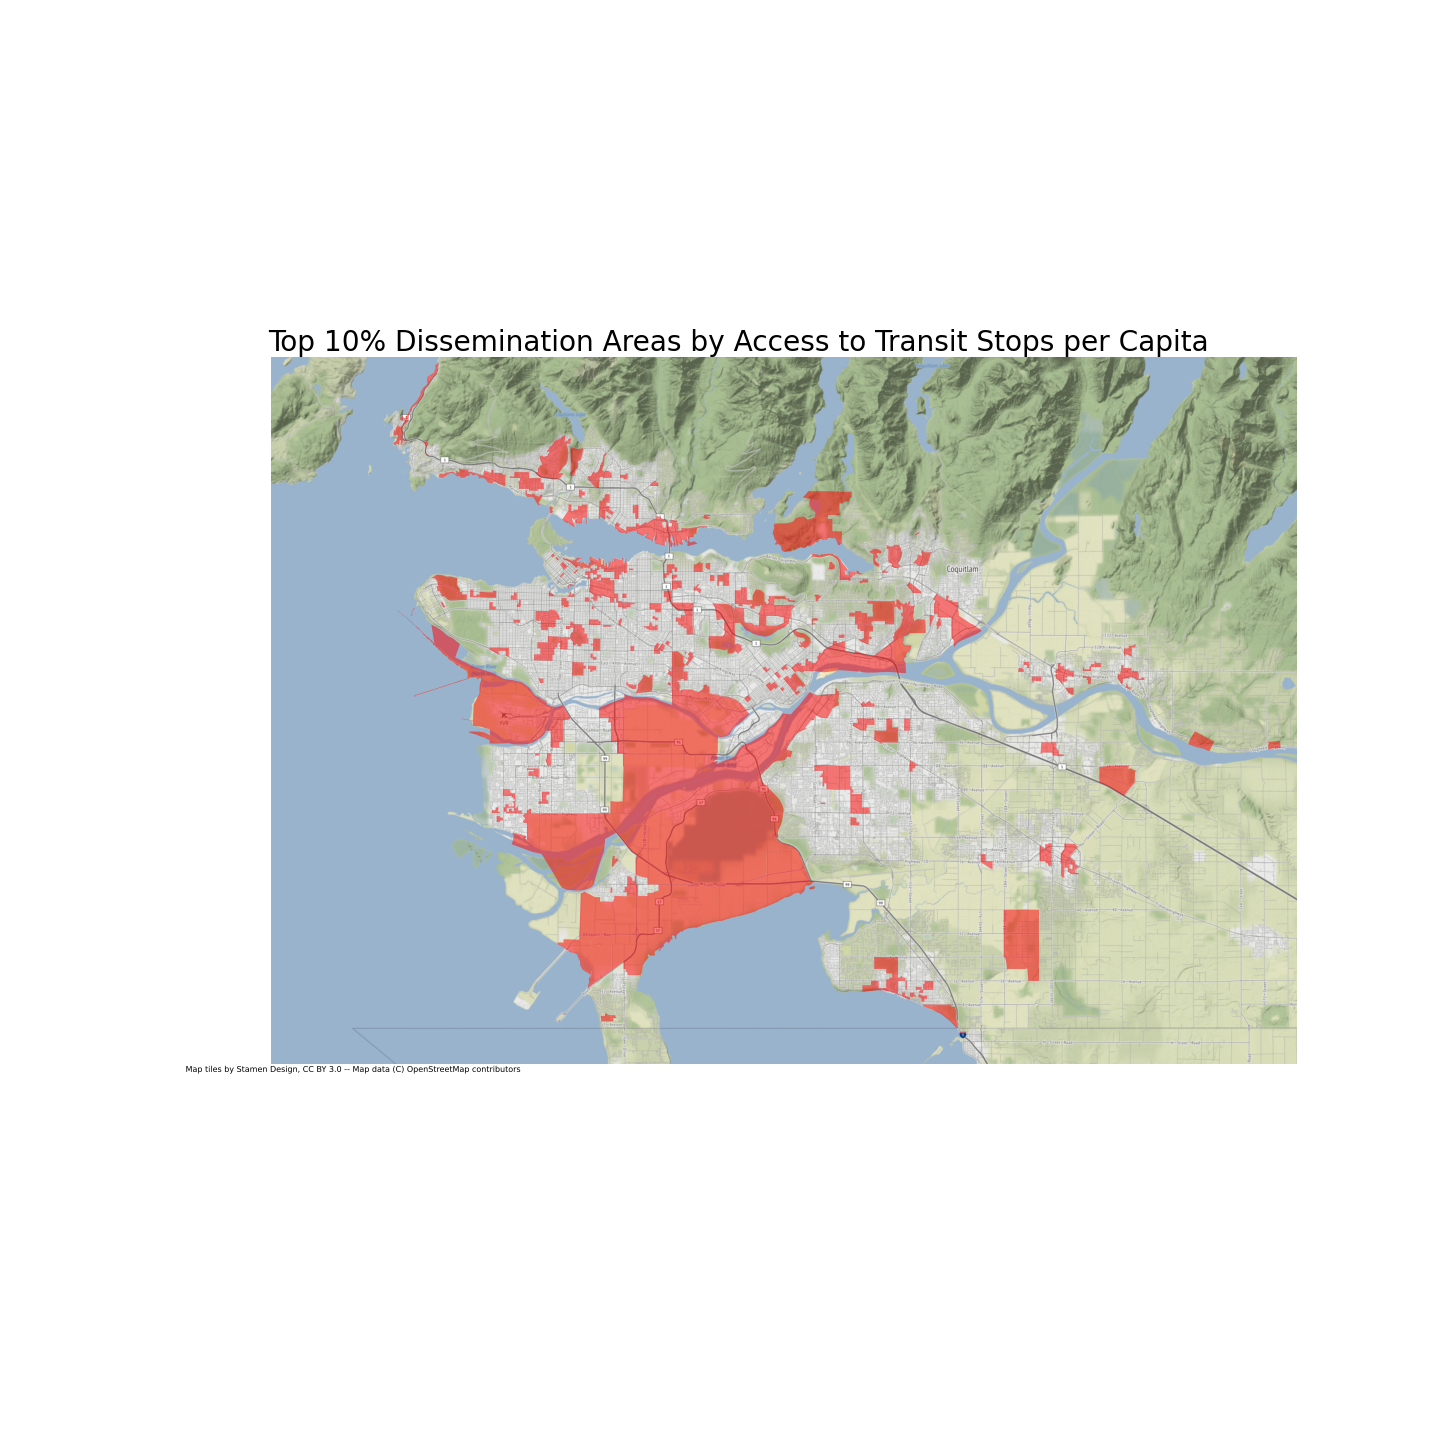
The following map shows DAs with top 10% transit stops per capita. The distribution of such areas is more widespread across GVA, extending to nearby cities including Surrey, Richmond, Burnaby, Coquitlam and Maple Ridge.
Usage of public transit
On the other side of the equation is residents’ usage of public transit. Fortunately, Canada’s 2016 census provides abundant information about residents’ usage of public transit to the DA level. In the “Journey to Work” section, the numbers of residents falling into the following categories are provided:
- commuters (aged 15 or older, living in private housing)
- commuters using truck, car or van to go to work as drivers
- commuters using truck, car or van to go to work as passengers
- commuters using public transport
- people who walk to work
- people who cycle to work
- people who commute to work with other methods
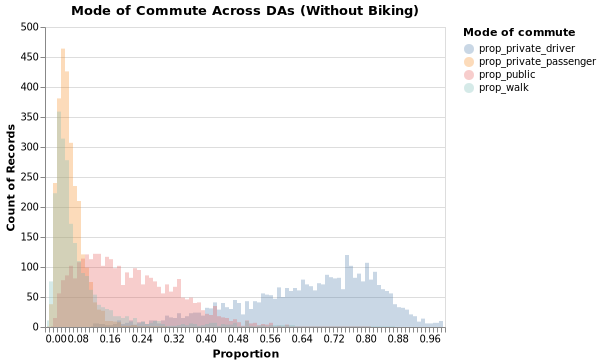
As shown in the following chart, for most DAs, the majority of people commute as drivers of private vehicles. However, there is a substantial number of DAs where around (or a little bit less than) half residents commute use public transit. For almost all DAs, only a tiny proportion of commuters bike, walk or use private vehicles as a passenger.
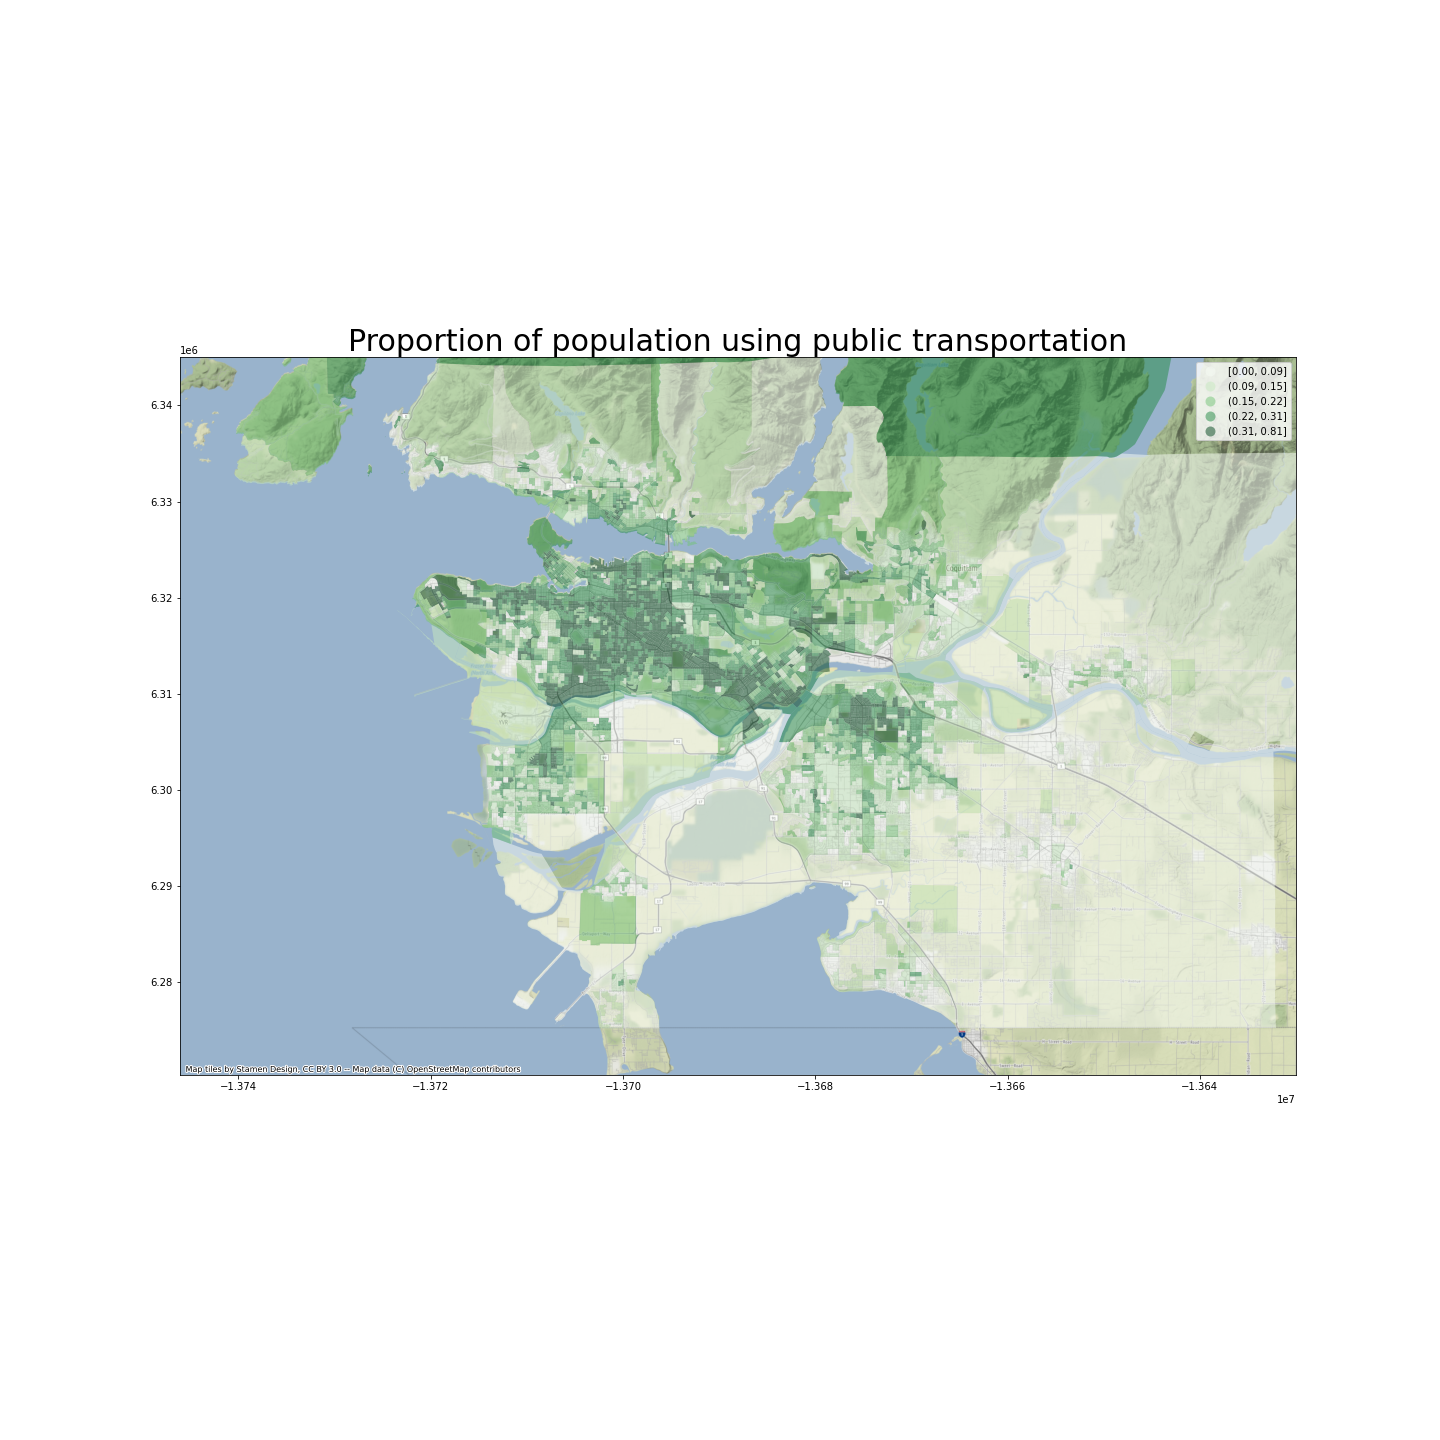
In average, in the Greater Vancouver Area, 20.4% of residents commute using public transportation. Where do people use public transit the most? As shown in the followng map, the corridor along Highway 1A from Mount Pleasant through East Vancouver, Metrotown to New Westerminster see relatively high proportion of transit use. In fact, New Westminster has the highest proportion of residents (31.3%) commuting using public transportation in the GVA. In addition, areas including Surrey, South Vancouver and Sunset also have relatively high proportion of people using public transit.
Transit duration and destination
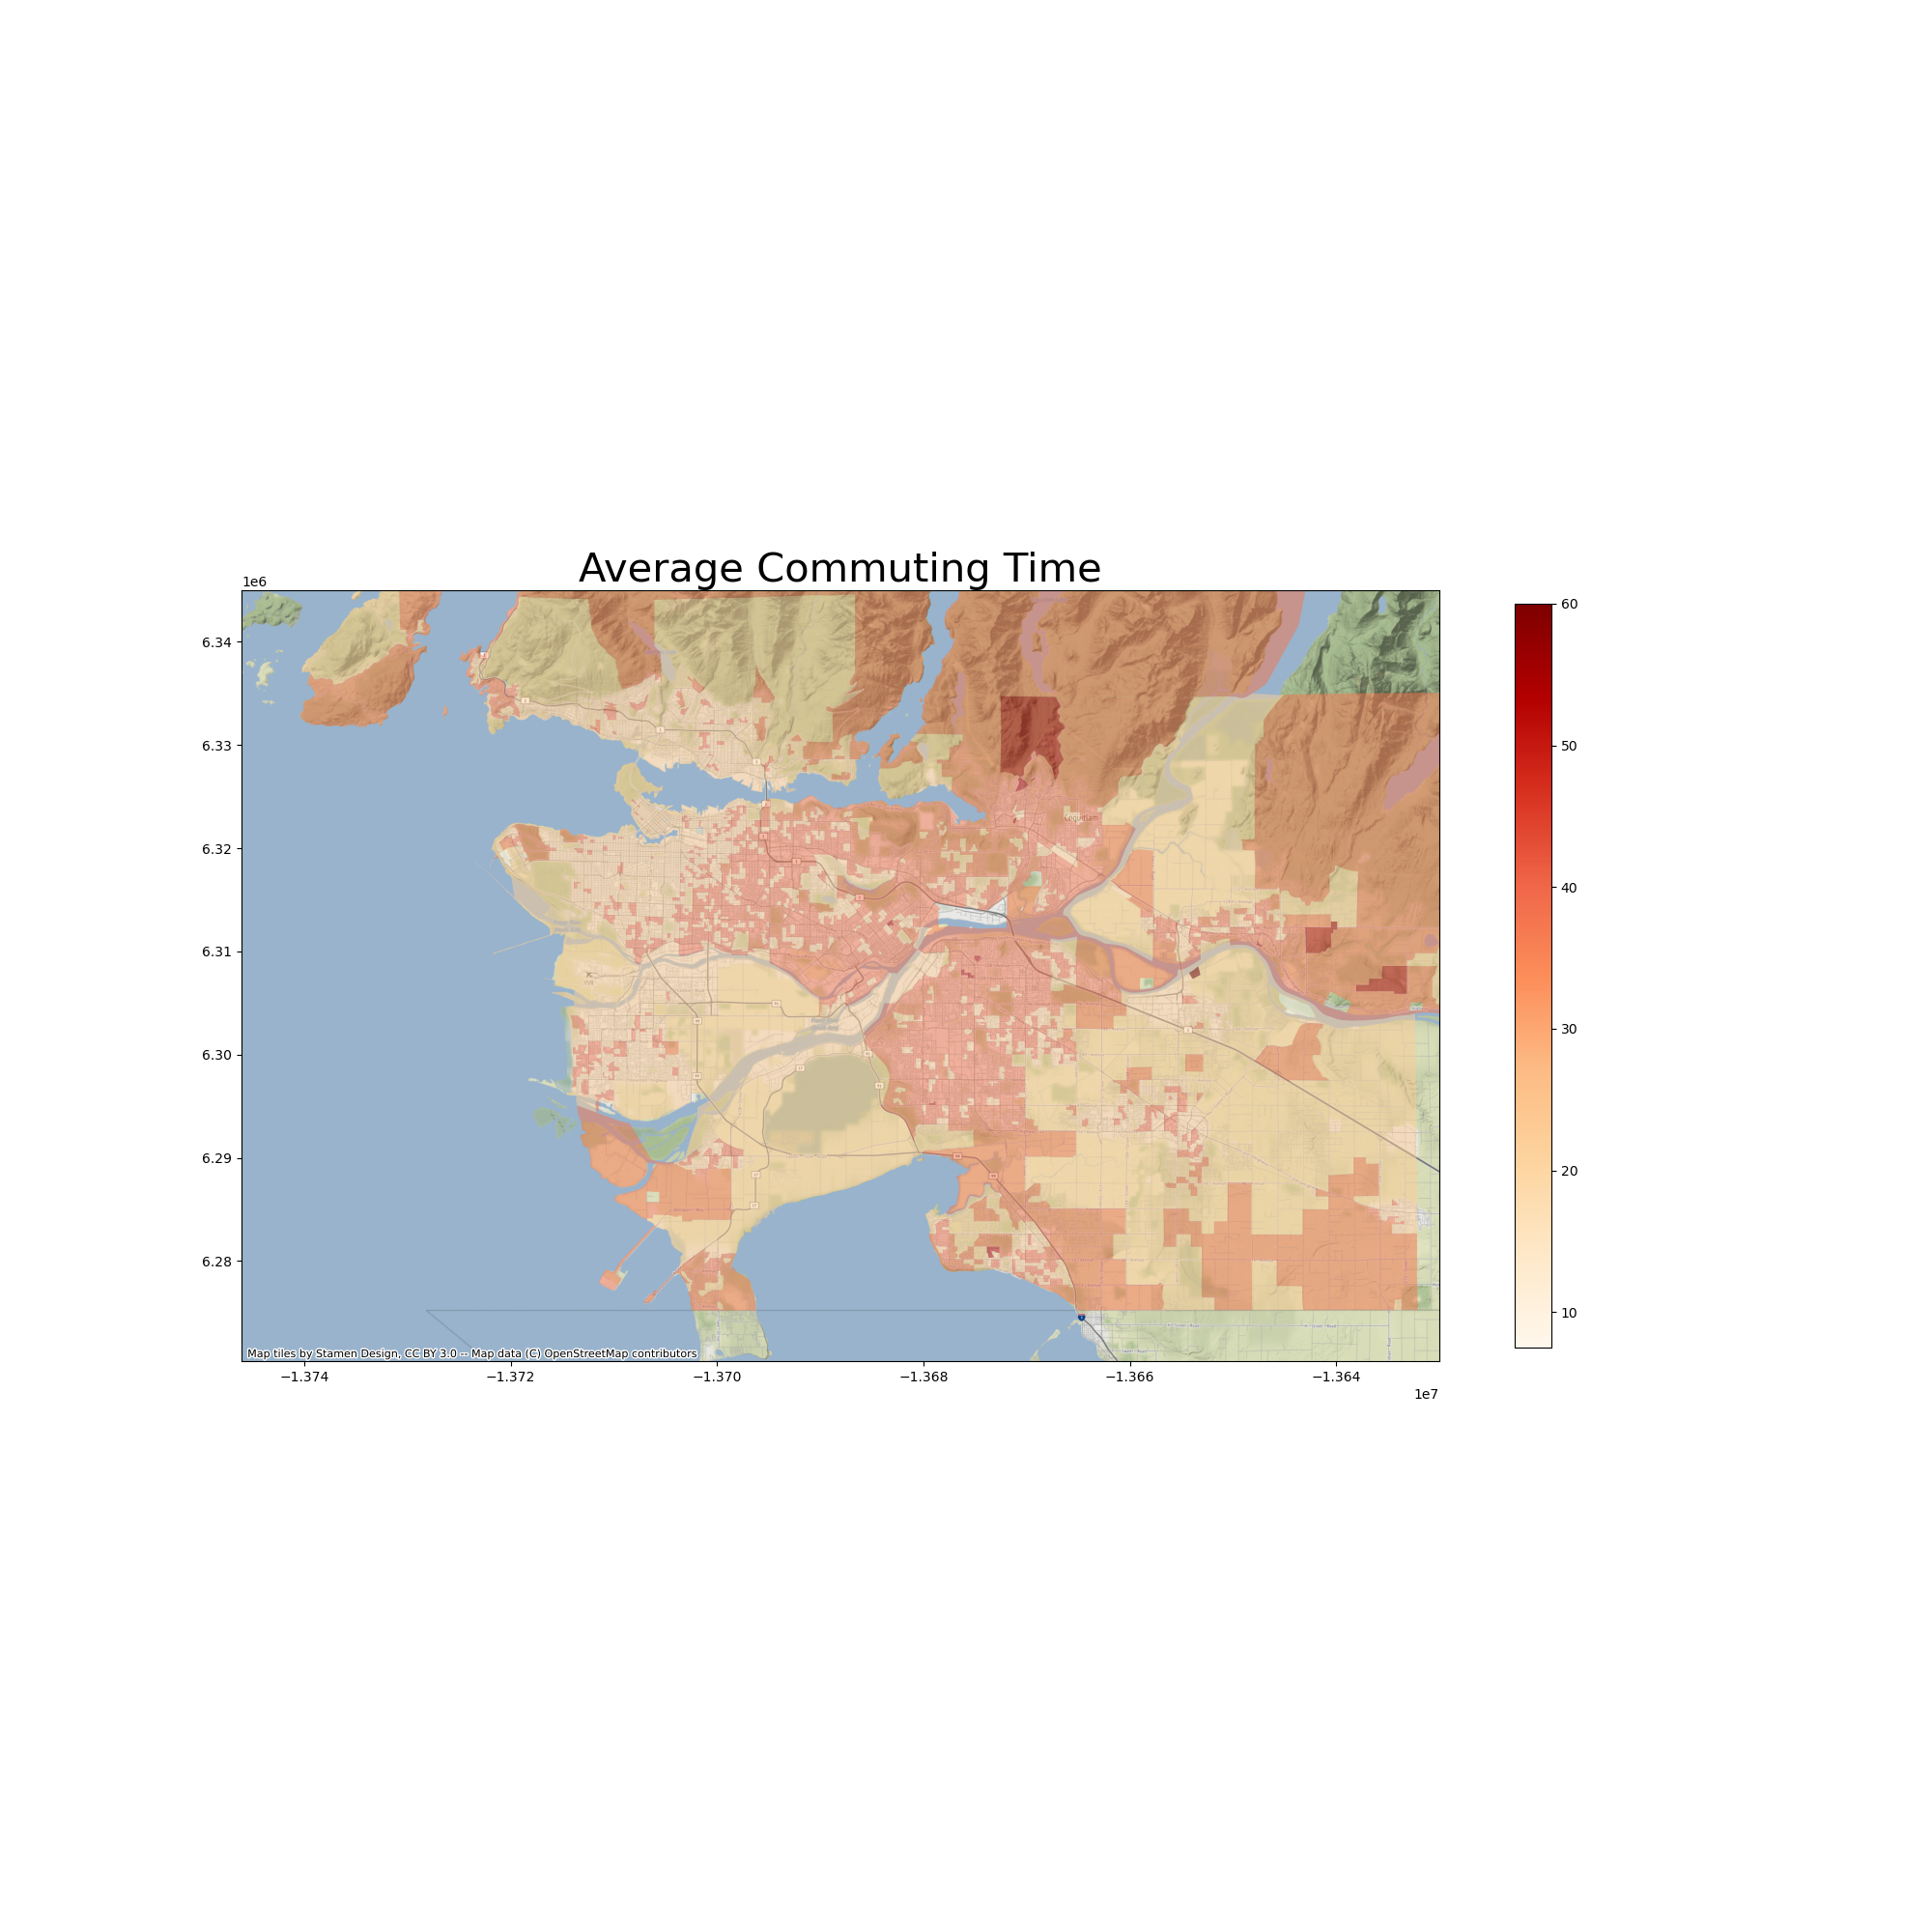
The census also tells us about people’s transit destinations, and the average commuting time of different DAs. In the Greater Vancouver Area, the average medium commute duration across CSDs is about 30.2 minutes. As shown in the following map, people living in DAs in the west half of the metropolitan area spend relatively less time commuting, whereas people living in areas in the east, including Burnaby, Coquitlam and Surrey spend longer time in commute.
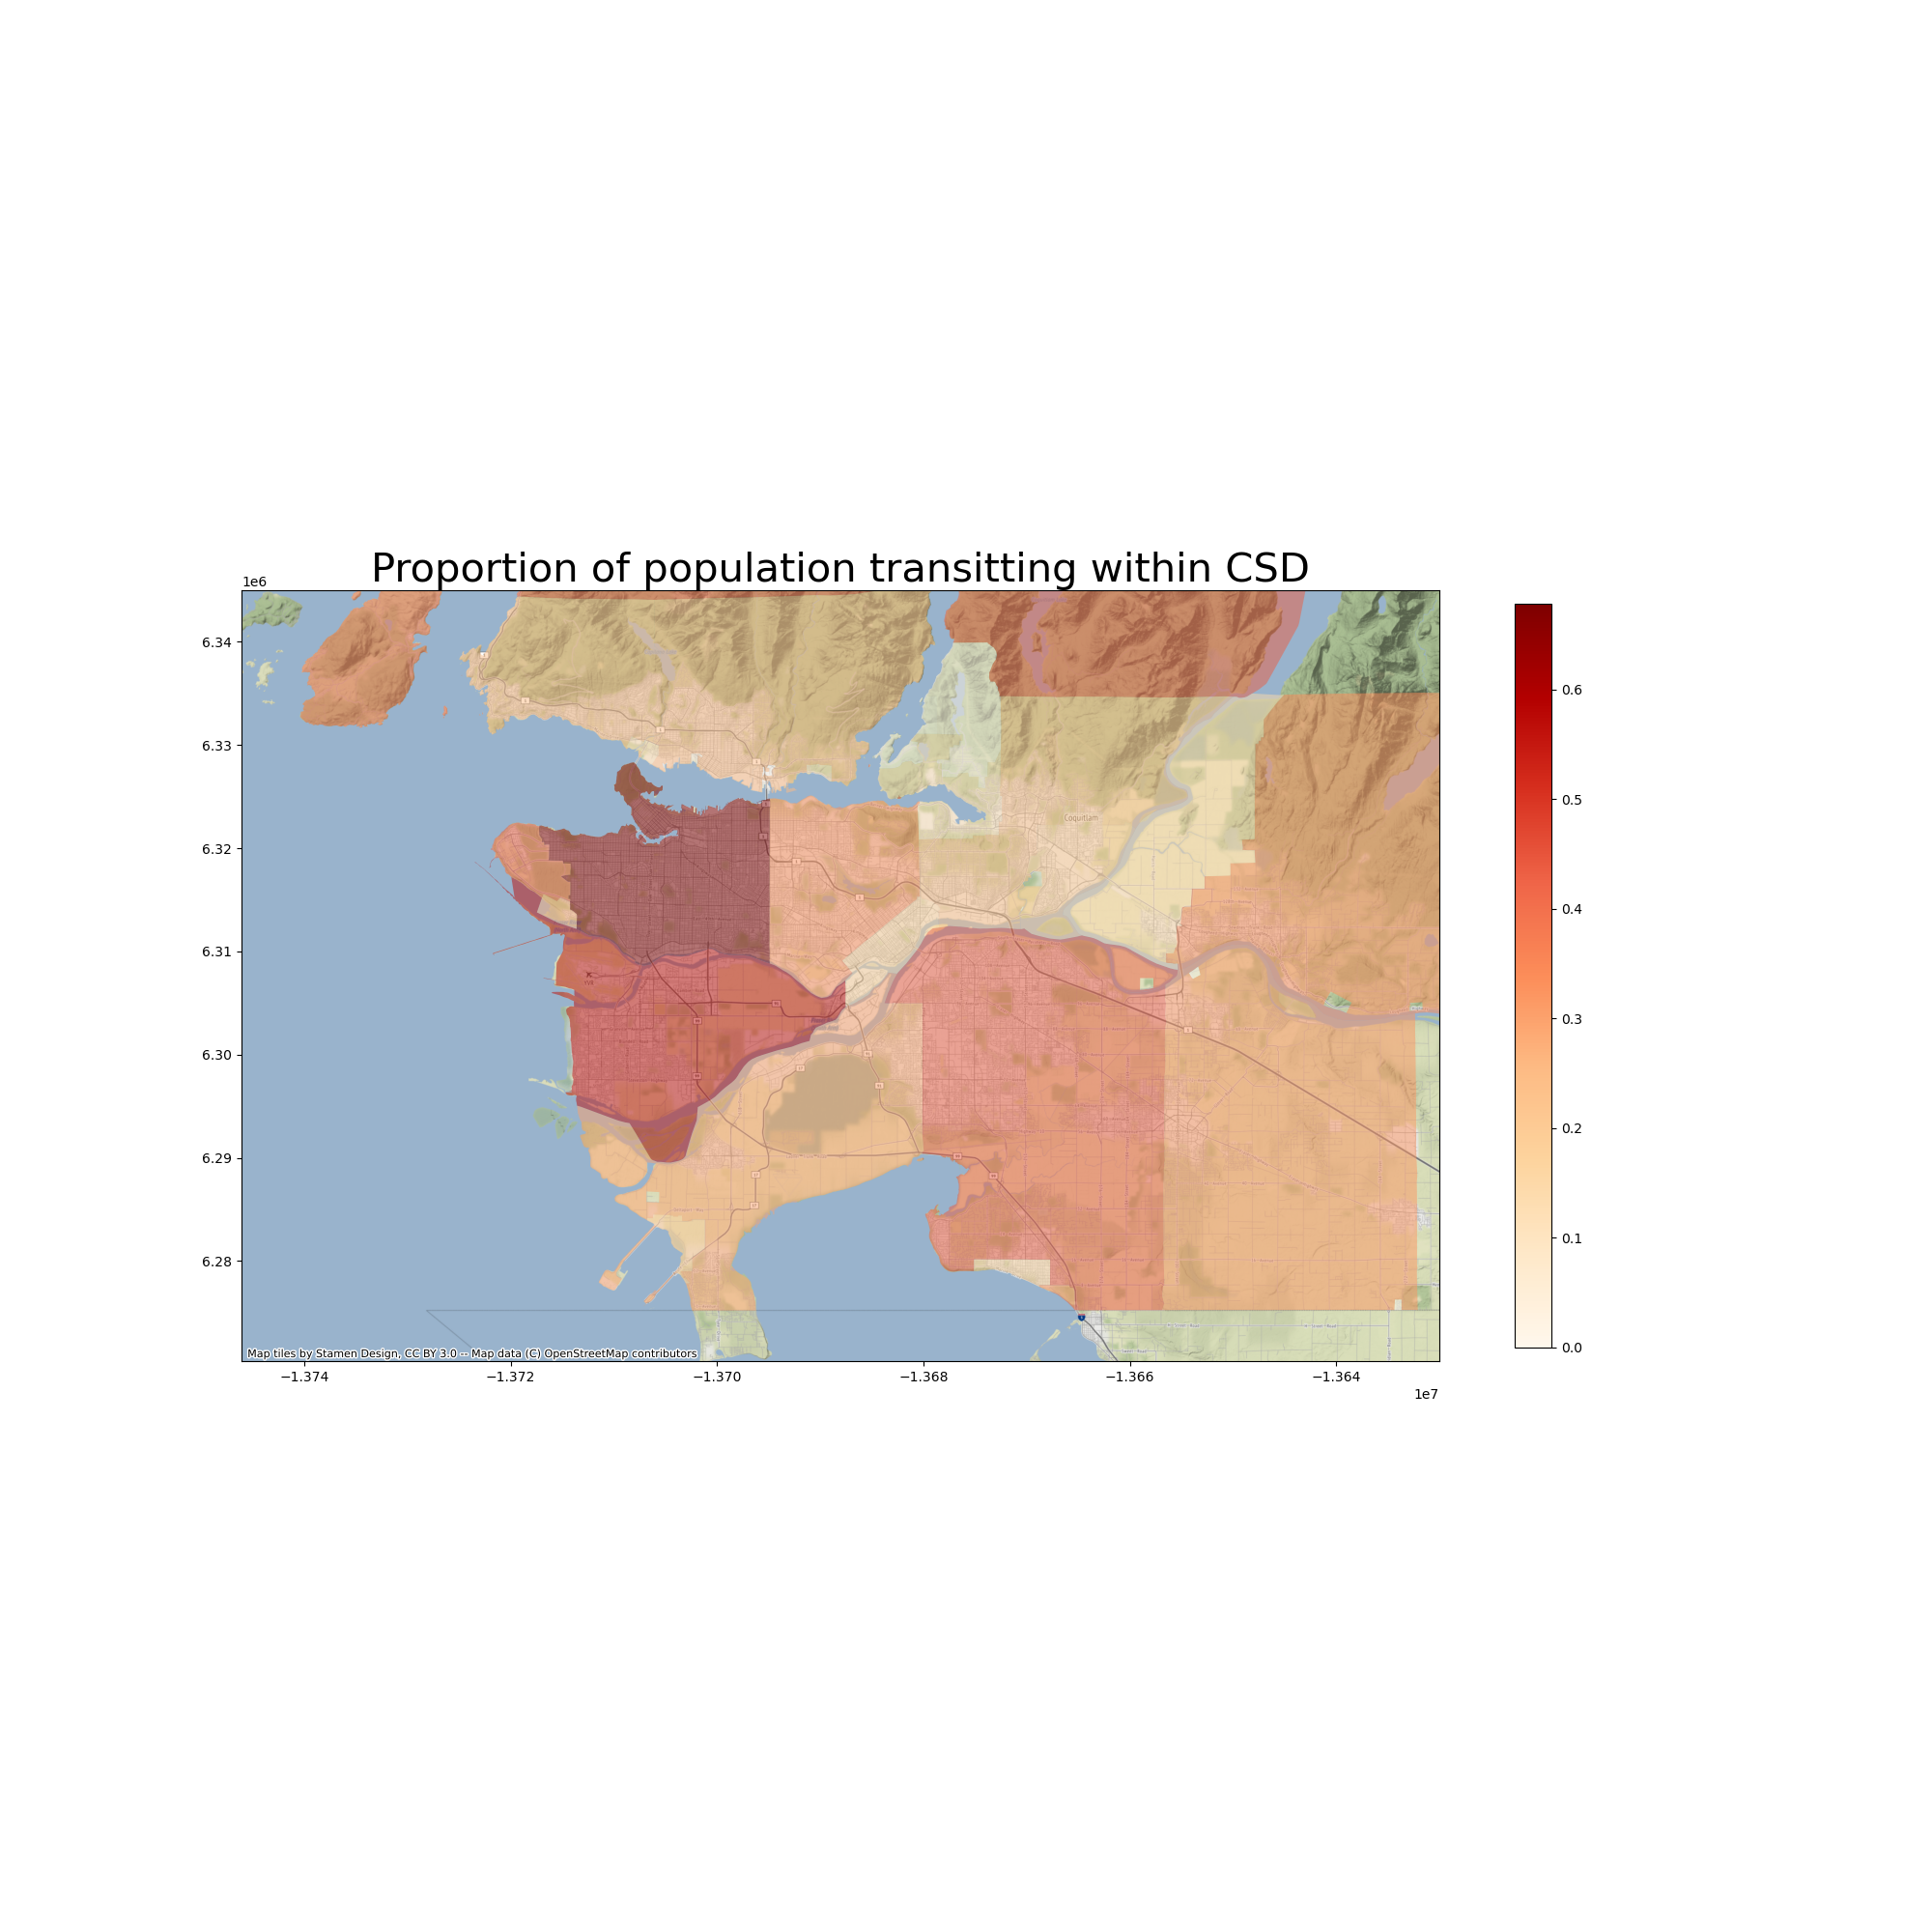
When it comes to the destination of commuting, an average of 44.1% of residents commute within their CSDs in the Greater Vancouver Area. The City of Vancouver has the highest proportion (67.8%) of residents commuting within the CSD. The map below shows the proportions of people who transit to work within their CSDs, by CSD. We can see that CSDs immediately neighboring the city of Vancouver have the lowest proportions of people working within own CSDs, probably because people there tend to transit to the City to work.
