Public Transportation in Vancouver: Suggestions from Machine Learning Models
The City of Vancouver aspires to have 33% of its residents using public transportation to commute by 2040 by advancing “new and improved” local and rapid transit. How can the public transit authority in the Greater Vancouver Area (GVA) best allocate its resources across the region to increase the number of residents using public transit?
I gathered data from Canada’s 2016 census and TransLink to analyze people’s access to, and usage of public transit. Using Random Forest and LASSO regression, I modeled the relationship between proportion of residents using public transit to commute and number of accessible public transit services, taking into account a wide range of socio-demographic factors. Then, I identified areas where a fixed amount of increase in transit access leads to the most increase in proportion of people using transit. These are the areas that GVA’s new public transportation development should focus on.
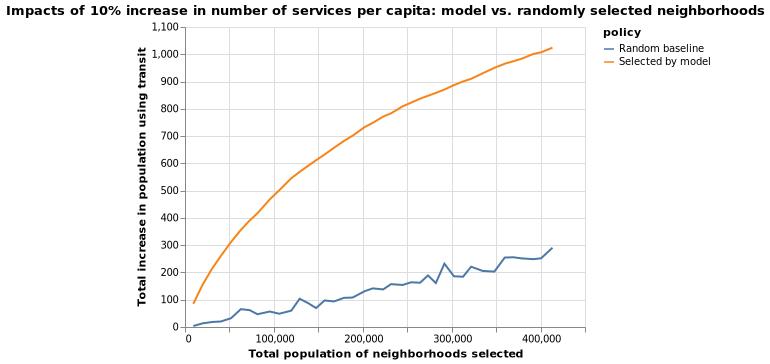
Pouring resources into priority neighborhoods identified in the model instead of randomly selected areas, GVA can potentially see a significant increase in the number of people using public transit. For example, if we target regions with a combined population of 100,000 selected by our model, and increase the number of transit services per capita to these regions by 10%, we are expected to see 0.5 percentage point increase in proportion of residents using transit, which translates into 500 people. By contrast, if we randomly select regions also with a combined population of 100,000, we only expect to see 80 more people using transit.
The following chart shows predicted number of new users of transit, as a function of population in the neighborhoods where GVA increases the number of public transit services by 10%. Our model can identify areas where investment in new public transportation services is most effective in increasing transit use.

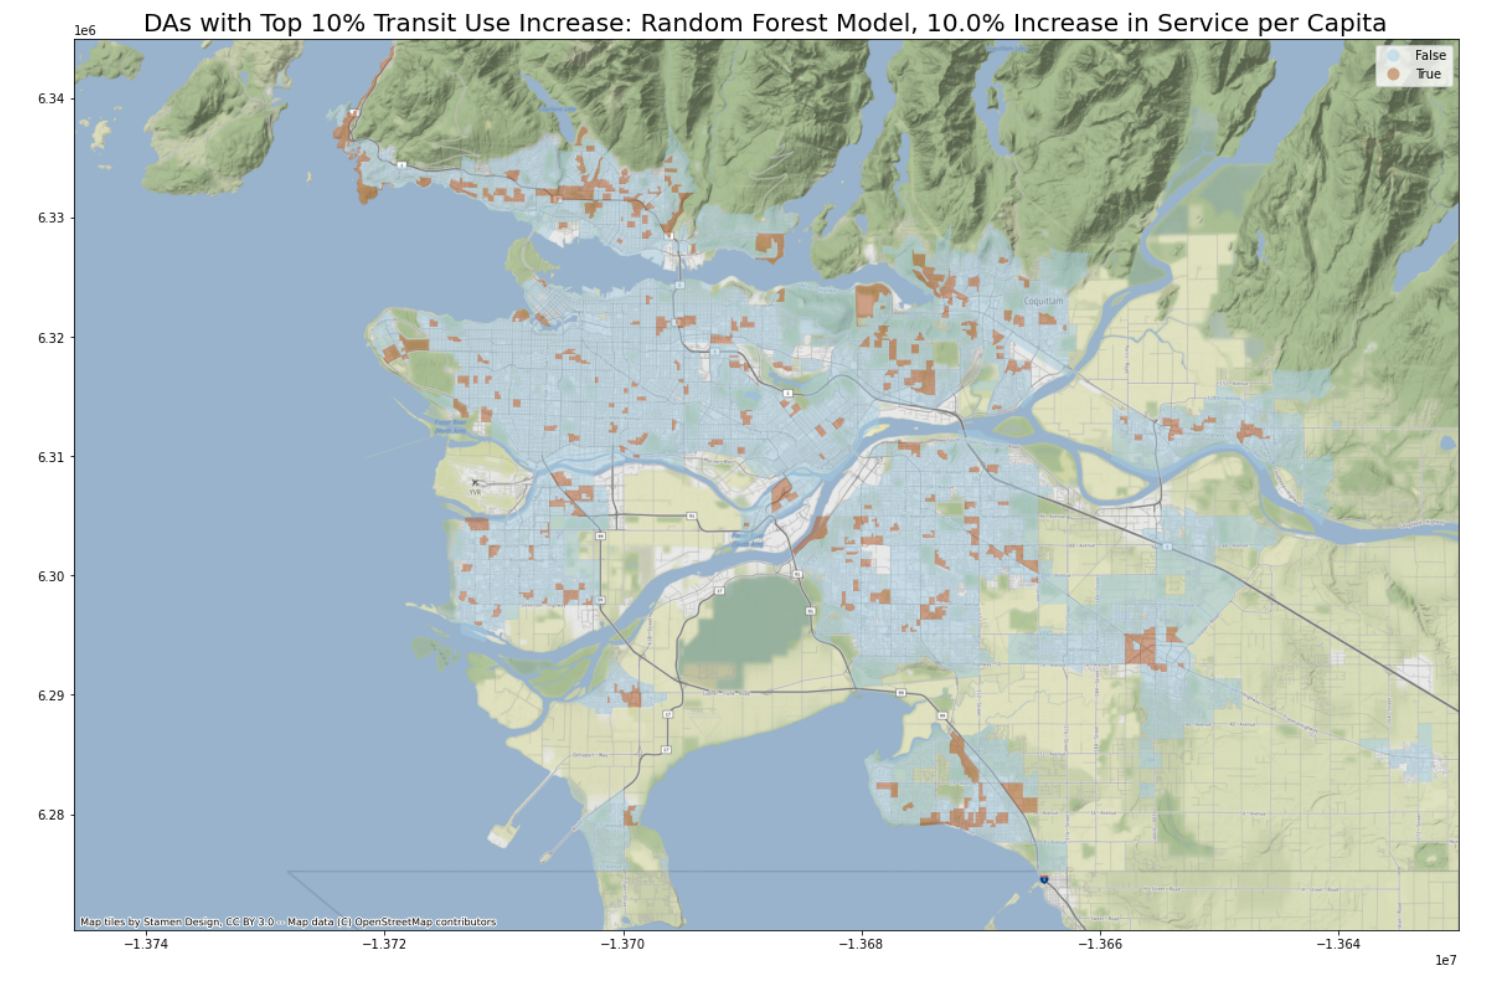
The following map highlights priority areas if GVA wants to target 10% of its neighborhoods, and increase the number of public transit services available to these areas by 10%.

For an interactive web application with simulation results of priority neighborhoods, see here.
A series of in-depth posts about this project include:
For the Jupyter Notebook with full analysIs, please see here. The GitHub repo of this analysis is located here.

