Geographical Analyses in Python
Abstract
This project is my homework submitted to the Intro to Python GIS course offered here by CSC Finland, IT Center for Science.
In the first part, I created a static map showing the nearest distance from anywhere in downtown Stockholm. In addition, I calculated the average public transportation commuting time in the city to the Railway station.
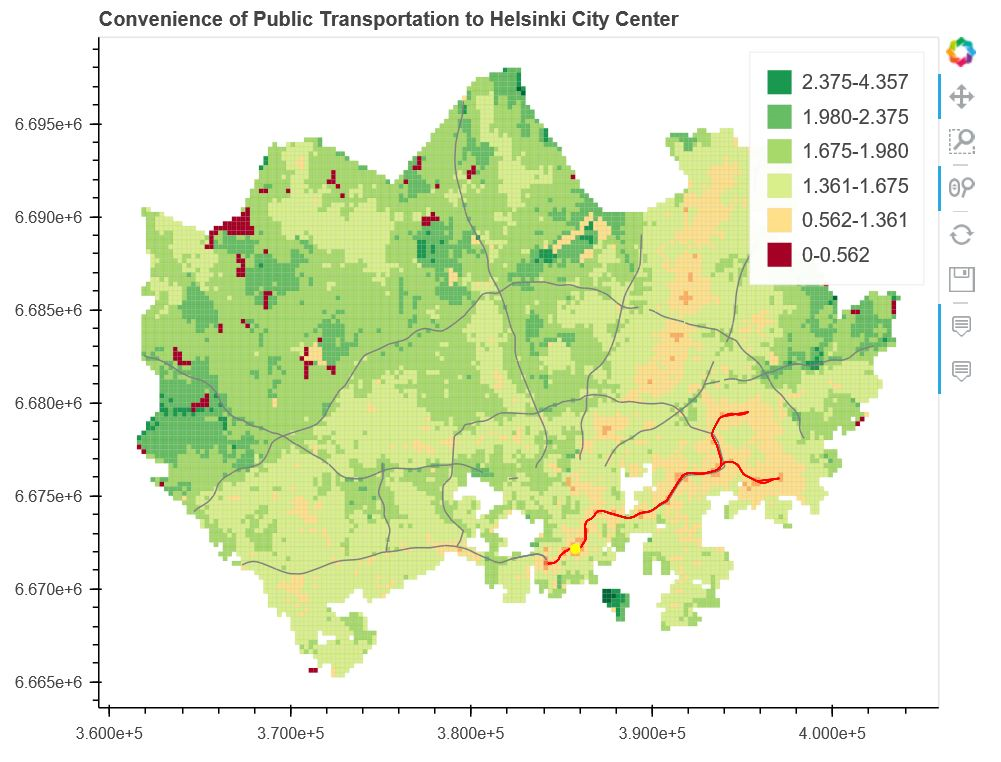
In the second part, I created an interactive map showing the convenience of public transportation to Railway Station across the city. Please see the final interactive map product here.
For code and more visualizations, please see Project page.
The project folder can be found here
Static mapping
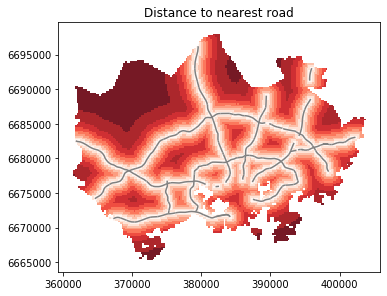
This static map shows the distance from each cell to the nearest road. Firstly, dissolve function of geopandas is used to combine multiple road geometries into one single multiple shape. Then, nearest_points of shapely is used to identify closet point on the roads shape that is closest to each cell (centroid used). I then used the distance method to calculate the minimum distances.
I also calculated the weighted public transportation commuting time from each cell to the Railway Station. I calculated the centroid of each population cell, and got their commuting times by overlapping them with the travel time shapefile. Then I averaged average commuting time weighted by populaiton.
The average public transportation commute time is 37.89 minutes

Interactive mapping
I measured the convenience of public transportation by the ratio of public transportation commuting time to car commuting time. Then I used bokeh package to develop an interactive map showing this index.

